MsciInc MSCI full analysis,charts,indicators,moving averages,SMA,DMA,EMA,ADX,MACD,RSIMsci Inc MSCI WideScreen charts, DMA,SMA,EMA technical analysis, forecast prediction, by indicators ADX,MACD,RSI,CCI NYSE stock exchange
operates under Miscellaneous sector & deals in Business Services
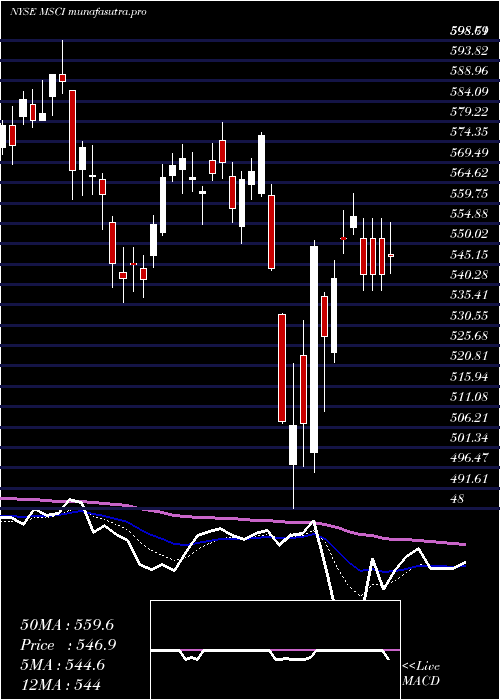
Daily price and charts and targets MsciInc Strong Daily Stock price targets for MsciInc MSCI are 528.55 and 541.2 | Daily Target 1 | 525.31 | | Daily Target 2 | 531.79 | | Daily Target 3 | 537.96333333333 | | Daily Target 4 | 544.44 | | Daily Target 5 | 550.61 |
Daily price and volume Msci Inc
| Date |
Closing |
Open |
Range |
Volume |
Fri 05 December 2025 |
538.26 (-0.48%) |
540.00 |
531.49 - 544.14 |
1.2446 times |
Thu 04 December 2025 |
540.85 (-0.86%) |
545.12 |
538.26 - 550.00 |
1.2736 times |
Wed 03 December 2025 |
545.56 (-0.34%) |
546.11 |
545.00 - 553.44 |
1.5521 times |
Tue 02 December 2025 |
547.43 (-2.19%) |
558.98 |
546.71 - 561.50 |
0.4802 times |
Mon 01 December 2025 |
559.66 (-0.72%) |
559.81 |
558.16 - 565.79 |
1.0142 times |
Fri 28 November 2025 |
563.72 (0.17%) |
564.19 |
560.64 - 567.21 |
0.3895 times |
Wed 26 November 2025 |
562.74 (-0.03%) |
560.68 |
556.60 - 566.99 |
0.8974 times |
Tue 25 November 2025 |
562.92 (1.14%) |
556.77 |
556.06 - 565.23 |
0.964 times |
Mon 24 November 2025 |
556.60 (-0.96%) |
561.23 |
556.25 - 567.41 |
1.2826 times |
Fri 21 November 2025 |
561.99 (0.34%) |
561.39 |
559.63 - 570.91 |
0.9019 times |
Thu 20 November 2025 |
560.08 (0.09%) |
564.96 |
558.70 - 568.63 |
0.893 times |
Weekly price and charts MsciInc Strong weekly Stock price targets for MsciInc MSCI are 517.73 and 552.03 | Weekly Target 1 | 510.88 | | Weekly Target 2 | 524.57 | | Weekly Target 3 | 545.18 | | Weekly Target 4 | 558.87 | | Weekly Target 5 | 579.48 |
Weekly price and volumes for Msci Inc
| Date |
Closing |
Open |
Range |
Volume |
Fri 05 December 2025 |
538.26 (-4.52%) |
559.81 |
531.49 - 565.79 |
1.3214 times |
Fri 28 November 2025 |
563.72 (0.31%) |
561.23 |
556.06 - 567.41 |
0.8391 times |
Fri 21 November 2025 |
561.99 (-0.56%) |
562.15 |
550.01 - 570.91 |
1.0983 times |
Fri 14 November 2025 |
565.15 (-3.04%) |
581.86 |
564.52 - 591.00 |
0.9726 times |
Fri 07 November 2025 |
582.85 (-0.97%) |
583.35 |
567.12 - 583.68 |
0.8686 times |
Fri 31 October 2025 |
588.55 (0%) |
579.16 |
576.58 - 591.47 |
0.3229 times |
Fri 31 October 2025 |
588.55 (8.53%) |
545.55 |
542.79 - 594.38 |
1.8021 times |
Fri 24 October 2025 |
542.29 (1.49%) |
528.68 |
525.31 - 547.88 |
0.9776 times |
Fri 17 October 2025 |
534.35 (-4.6%) |
564.06 |
526.07 - 572.40 |
0.9898 times |
Fri 03 October 2025 |
560.12 (-0.94%) |
566.85 |
545.01 - 571.87 |
0.8076 times |
Fri 26 September 2025 |
565.42 (1.01%) |
559.00 |
557.00 - 572.79 |
1.2098 times |
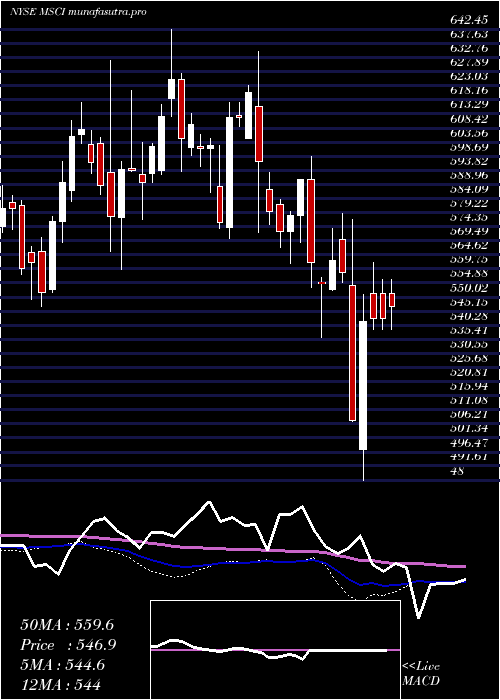
Monthly price and charts MsciInc Strong monthly Stock price targets for MsciInc MSCI are 517.73 and 552.03 | Monthly Target 1 | 510.88 | | Monthly Target 2 | 524.57 | | Monthly Target 3 | 545.18 | | Monthly Target 4 | 558.87 | | Monthly Target 5 | 579.48 |
Monthly price and volumes Msci Inc
| Date |
Closing |
Open |
Range |
Volume |
Fri 05 December 2025 |
538.26 (-4.52%) |
559.81 |
531.49 - 565.79 |
0.3047 times |
Fri 28 November 2025 |
563.72 (-4.22%) |
583.35 |
550.01 - 591.00 |
0.8712 times |
Fri 31 October 2025 |
588.55 (3.73%) |
567.01 |
525.31 - 594.38 |
1.047 times |
Tue 30 September 2025 |
567.41 (-0.05%) |
560.66 |
548.00 - 585.84 |
1.3815 times |
Fri 29 August 2025 |
567.72 (1.13%) |
559.14 |
541.50 - 580.23 |
1.0653 times |
Thu 31 July 2025 |
561.36 (-2.67%) |
574.40 |
525.00 - 593.27 |
1.6272 times |
Mon 30 June 2025 |
576.74 (2.26%) |
557.65 |
539.65 - 579.07 |
0.8333 times |
Fri 30 May 2025 |
564.02 (3.47%) |
543.00 |
539.67 - 576.77 |
0.8137 times |
Wed 30 April 2025 |
545.11 (-3.61%) |
564.18 |
486.74 - 576.72 |
1.0947 times |
Mon 31 March 2025 |
565.50 (-4.24%) |
590.51 |
535.92 - 598.71 |
0.9615 times |
Fri 28 February 2025 |
590.51 (-1.05%) |
587.19 |
561.71 - 592.95 |
1.0241 times |

DMA SMA EMA moving averages of Msci Inc MSCI
DMA (daily moving average) of Msci Inc MSCI
| DMA period | DMA value | | 5 day DMA | 546.35 | | 12 day DMA | 554.95 | | 20 day DMA | 561.88 | | 35 day DMA | 561.81 | | 50 day DMA | 561.66 | | 100 day DMA | 562.25 | | 150 day DMA | 562.24 | | 200 day DMA | 561.16 | EMA (exponential moving average) of Msci Inc MSCI
| EMA period | EMA current | EMA prev | EMA prev2 | | 5 day EMA | 545.41 | 548.98 | 553.04 | | 12 day EMA | 553.1 | 555.8 | 558.52 | | 20 day EMA | 557.39 | 559.4 | 561.35 | | 35 day EMA | 559.79 | 561.06 | 562.25 | | 50 day EMA | 560.94 | 561.87 | 562.73 |
SMA (simple moving average) of Msci Inc MSCI
| SMA period | SMA current | SMA prev | SMA prev2 | | 5 day SMA | 546.35 | 551.44 | 555.82 | | 12 day SMA | 554.95 | 556.5 | 557.92 | | 20 day SMA | 561.88 | 563.99 | 565.54 | | 35 day SMA | 561.81 | 561.67 | 561.91 | | 50 day SMA | 561.66 | 562.02 | 562.77 | | 100 day SMA | 562.25 | 562.69 | 563.09 | | 150 day SMA | 562.24 | 562.19 | 562.18 | | 200 day SMA | 561.16 | 561.39 | 561.58 |
|
|
