MsaSafety MSA full analysis,charts,indicators,moving averages,SMA,DMA,EMA,ADX,MACD,RSIMsa Safety MSA WideScreen charts, DMA,SMA,EMA technical analysis, forecast prediction, by indicators ADX,MACD,RSI,CCI NYSE stock exchange
operates under Health Care sector & deals in Industrial Specialties
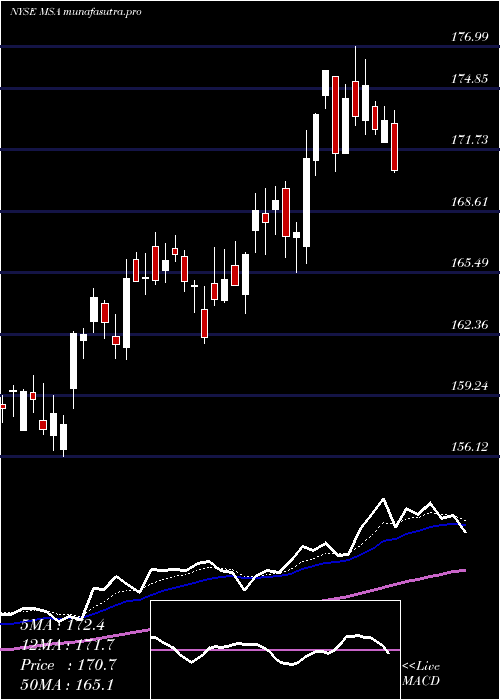
Daily price and charts and targets MsaSafety Strong Daily Stock price targets for MsaSafety MSA are 165.53 and 167.91 | Daily Target 1 | 163.68 | | Daily Target 2 | 164.99 | | Daily Target 3 | 166.05666666667 | | Daily Target 4 | 167.37 | | Daily Target 5 | 168.44 |
Daily price and volume Msa Safety
| Date |
Closing |
Open |
Range |
Volume |
Mon 20 October 2025 |
166.31 (0.75%) |
165.84 |
164.74 - 167.12 |
1.0737 times |
Fri 17 October 2025 |
165.07 (0.02%) |
165.28 |
164.10 - 165.69 |
1.0164 times |
Thu 16 October 2025 |
165.04 (-1.42%) |
167.68 |
164.20 - 167.68 |
0.963 times |
Wed 15 October 2025 |
167.41 (-0.26%) |
167.80 |
164.77 - 169.53 |
1.5461 times |
Tue 14 October 2025 |
167.85 (-0.84%) |
167.59 |
167.59 - 170.21 |
1.0351 times |
Mon 13 October 2025 |
169.27 (-0.76%) |
171.49 |
169.25 - 171.72 |
1.4266 times |
Fri 10 October 2025 |
170.57 (-0.01%) |
170.86 |
169.79 - 171.83 |
0.9801 times |
Thu 09 October 2025 |
170.58 (-1.74%) |
174.22 |
169.53 - 174.64 |
0.7444 times |
Wed 08 October 2025 |
173.60 (0.88%) |
172.73 |
171.34 - 173.83 |
0.5985 times |
Tue 07 October 2025 |
172.09 (-1.76%) |
175.33 |
171.07 - 176.25 |
0.6161 times |
Mon 06 October 2025 |
175.18 (0.68%) |
174.10 |
173.22 - 177.20 |
0.5379 times |
Weekly price and charts MsaSafety Strong weekly Stock price targets for MsaSafety MSA are 165.53 and 167.91 | Weekly Target 1 | 163.68 | | Weekly Target 2 | 164.99 | | Weekly Target 3 | 166.05666666667 | | Weekly Target 4 | 167.37 | | Weekly Target 5 | 168.44 |
Weekly price and volumes for Msa Safety
| Date |
Closing |
Open |
Range |
Volume |
Mon 20 October 2025 |
166.31 (0.75%) |
165.84 |
164.74 - 167.12 |
0.2179 times |
Fri 17 October 2025 |
165.07 (-3.22%) |
171.49 |
164.10 - 171.72 |
1.2151 times |
Fri 10 October 2025 |
170.57 (-1.97%) |
174.10 |
169.53 - 177.20 |
0.7056 times |
Fri 03 October 2025 |
174.00 (1.83%) |
171.40 |
169.91 - 174.99 |
1.0108 times |
Fri 26 September 2025 |
170.88 (-0.05%) |
170.47 |
167.92 - 173.94 |
1.0689 times |
Fri 19 September 2025 |
170.97 (1.01%) |
169.19 |
166.79 - 173.27 |
2.1886 times |
Fri 12 September 2025 |
169.26 (-0.7%) |
169.35 |
167.57 - 173.19 |
1.4862 times |
Fri 05 September 2025 |
170.46 (-0.08%) |
168.94 |
167.51 - 173.62 |
0.8634 times |
Fri 29 August 2025 |
170.60 (0%) |
172.63 |
170.00 - 173.66 |
0.2085 times |
Fri 29 August 2025 |
170.60 (-3.05%) |
175.64 |
168.73 - 175.64 |
1.0349 times |
Fri 22 August 2025 |
175.96 (3.74%) |
169.71 |
169.43 - 176.46 |
0.8918 times |
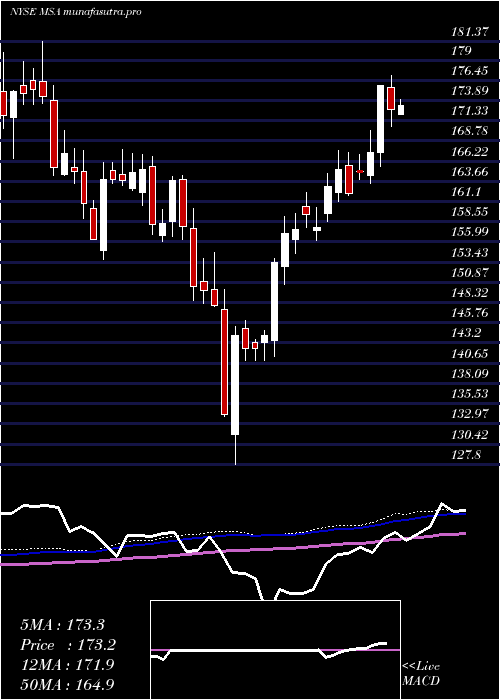
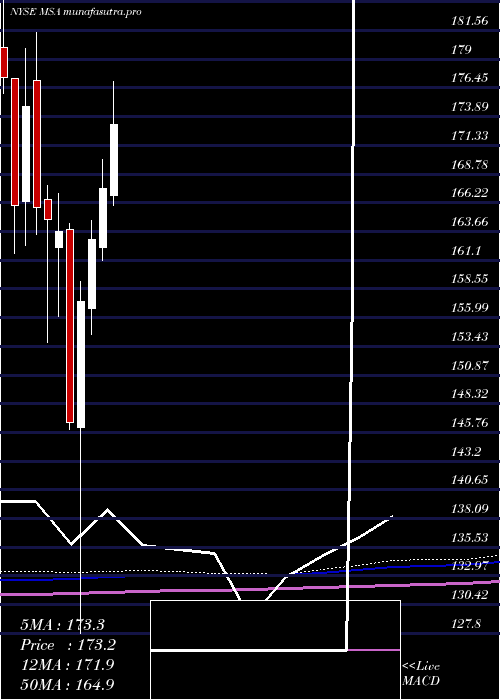
Monthly price and charts MsaSafety Strong monthly Stock price targets for MsaSafety MSA are 158.66 and 171.76 | Monthly Target 1 | 156.1 | | Monthly Target 2 | 161.21 | | Monthly Target 3 | 169.20333333333 | | Monthly Target 4 | 174.31 | | Monthly Target 5 | 182.3 |
Monthly price and volumes Msa Safety
| Date |
Closing |
Open |
Range |
Volume |
Mon 20 October 2025 |
166.31 (-3.35%) |
171.26 |
164.10 - 177.20 |
0.5689 times |
Tue 30 September 2025 |
172.07 (0.86%) |
168.94 |
166.79 - 173.94 |
1.3365 times |
Fri 29 August 2025 |
170.60 (-4.09%) |
175.45 |
167.63 - 182.86 |
1.1477 times |
Thu 31 July 2025 |
177.87 (6.17%) |
166.82 |
165.94 - 181.05 |
0.9801 times |
Mon 30 June 2025 |
167.53 (2.8%) |
162.23 |
161.08 - 170.11 |
1.1172 times |
Fri 30 May 2025 |
162.97 (3.53%) |
156.85 |
154.52 - 164.68 |
1.1795 times |
Wed 30 April 2025 |
157.42 (7.31%) |
146.20 |
127.86 - 159.24 |
1.3291 times |
Mon 31 March 2025 |
146.69 (-10.39%) |
163.88 |
146.01 - 164.38 |
0.8889 times |
Fri 28 February 2025 |
163.70 (-0.63%) |
162.25 |
156.06 - 167.00 |
0.7349 times |
Fri 31 January 2025 |
164.73 (-0.63%) |
166.55 |
153.79 - 167.77 |
0.7172 times |
Tue 31 December 2024 |
165.77 (-5.16%) |
177.09 |
163.41 - 181.37 |
0.8632 times |
DMA SMA EMA moving averages of Msa Safety MSA
DMA (daily moving average) of Msa Safety MSA
| DMA period | DMA value | | 5 day DMA | 166.34 | | 12 day DMA | 169.75 | | 20 day DMA | 170.38 | | 35 day DMA | 170.24 | | 50 day DMA | 170.68 | | 100 day DMA | 170.78 | | 150 day DMA | 164.1 | | 200 day DMA | 163.47 | EMA (exponential moving average) of Msa Safety MSA
| EMA period | EMA current | EMA prev | EMA prev2 | | 5 day EMA | 166.66 | 166.84 | 167.73 | | 12 day EMA | 168.49 | 168.89 | 169.58 | | 20 day EMA | 169.44 | 169.77 | 170.26 | | 35 day EMA | 170.33 | 170.57 | 170.89 | | 50 day EMA | 170.64 | 170.82 | 171.05 |
SMA (simple moving average) of Msa Safety MSA
| SMA period | SMA current | SMA prev | SMA prev2 | | 5 day SMA | 166.34 | 166.93 | 168.03 | | 12 day SMA | 169.75 | 170.36 | 170.97 | | 20 day SMA | 170.38 | 170.68 | 170.98 | | 35 day SMA | 170.24 | 170.36 | 170.52 | | 50 day SMA | 170.68 | 170.74 | 170.92 | | 100 day SMA | 170.78 | 170.74 | 170.67 | | 150 day SMA | 164.1 | 163.99 | 163.9 | | 200 day SMA | 163.47 | 163.47 | 163.48 |
|
|
