MorganStanley MS-L full analysis,charts,indicators,moving averages,SMA,DMA,EMA,ADX,MACD,RSIMorgan Stanley MS-L WideScreen charts, DMA,SMA,EMA technical analysis, forecast prediction, by indicators ADX,MACD,RSI,CCI NYSE stock exchange
Daily price and charts and targets MorganStanley Strong Daily Stock price targets for MorganStanley MS-L are 21.43 and 21.49 | Daily Target 1 | 21.42 | | Daily Target 2 | 21.44 | | Daily Target 3 | 21.476666666667 | | Daily Target 4 | 21.5 | | Daily Target 5 | 21.54 |
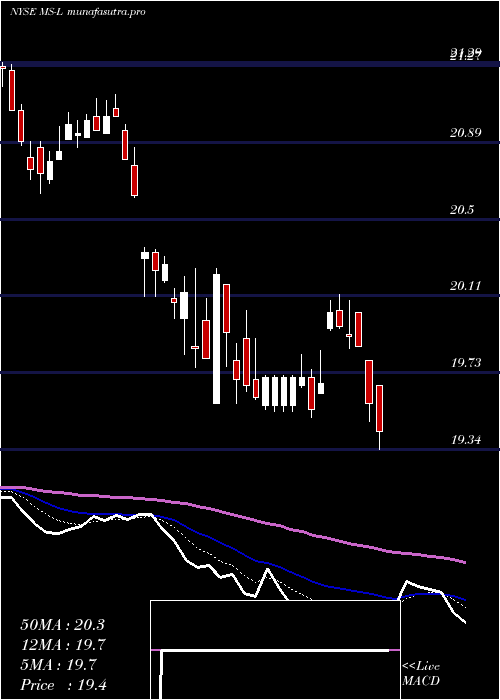
Daily price and volume Morgan Stanley
| Date |
Closing |
Open |
Range |
Volume |
Mon 20 October 2025 |
21.47 (0.66%) |
21.48 |
21.45 - 21.51 |
0.4146 times |
Fri 17 October 2025 |
21.33 (0.05%) |
21.28 |
21.23 - 21.34 |
1.637 times |
Thu 16 October 2025 |
21.32 (-0.79%) |
21.49 |
21.30 - 21.56 |
1.0878 times |
Wed 15 October 2025 |
21.49 (0.99%) |
21.40 |
21.38 - 21.50 |
1.2547 times |
Tue 14 October 2025 |
21.28 (-0.33%) |
21.34 |
21.19 - 21.34 |
0.3823 times |
Mon 13 October 2025 |
21.35 (0.33%) |
21.30 |
21.18 - 21.36 |
1.2116 times |
Fri 10 October 2025 |
21.28 (-0.56%) |
21.41 |
21.18 - 21.49 |
1.1255 times |
Thu 09 October 2025 |
21.40 (-0.37%) |
21.38 |
21.30 - 21.46 |
0.9047 times |
Wed 08 October 2025 |
21.48 (0.09%) |
21.48 |
21.45 - 21.54 |
0.6677 times |
Tue 07 October 2025 |
21.46 (-0.69%) |
21.62 |
21.41 - 21.74 |
1.3139 times |
Mon 06 October 2025 |
21.61 (-0.28%) |
21.61 |
21.56 - 21.70 |
1.3624 times |
Weekly price and charts MorganStanley Strong weekly Stock price targets for MorganStanley MS-L are 21.43 and 21.49 | Weekly Target 1 | 21.42 | | Weekly Target 2 | 21.44 | | Weekly Target 3 | 21.476666666667 | | Weekly Target 4 | 21.5 | | Weekly Target 5 | 21.54 |
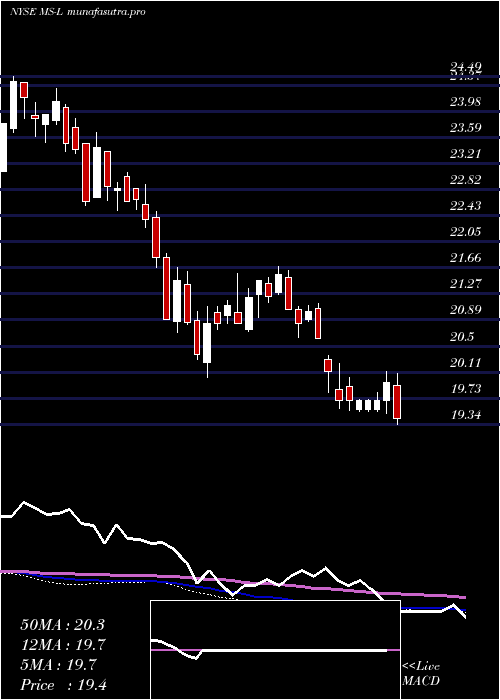
Weekly price and volumes for Morgan Stanley
| Date |
Closing |
Open |
Range |
Volume |
Mon 20 October 2025 |
21.47 (0.66%) |
21.48 |
21.45 - 21.51 |
0.0786 times |
Fri 17 October 2025 |
21.33 (0.23%) |
21.30 |
21.18 - 21.56 |
1.0563 times |
Fri 10 October 2025 |
21.28 (-1.8%) |
21.61 |
21.18 - 21.74 |
1.0186 times |
Fri 03 October 2025 |
21.67 (-1.1%) |
21.96 |
21.44 - 22.04 |
1.3054 times |
Fri 26 September 2025 |
21.91 (-0.95%) |
22.10 |
21.67 - 22.15 |
1.2278 times |
Fri 19 September 2025 |
22.12 (1.37%) |
21.90 |
21.83 - 22.28 |
1.3809 times |
Fri 12 September 2025 |
21.82 (3.12%) |
21.34 |
21.18 - 21.97 |
1.3819 times |
Fri 05 September 2025 |
21.16 (2.52%) |
20.47 |
20.47 - 21.19 |
0.7399 times |
Fri 29 August 2025 |
20.64 (0%) |
20.60 |
20.53 - 20.67 |
0.2133 times |
Fri 29 August 2025 |
20.64 (-0.1%) |
20.67 |
20.51 - 20.78 |
1.5973 times |
Fri 22 August 2025 |
20.66 (2.02%) |
20.30 |
20.24 - 20.71 |
1.9075 times |
Monthly price and charts MorganStanley Strong monthly Stock price targets for MorganStanley MS-L are 21.33 and 21.9 | Monthly Target 1 | 20.9 | | Monthly Target 2 | 21.18 | | Monthly Target 3 | 21.466666666667 | | Monthly Target 4 | 21.75 | | Monthly Target 5 | 22.04 |
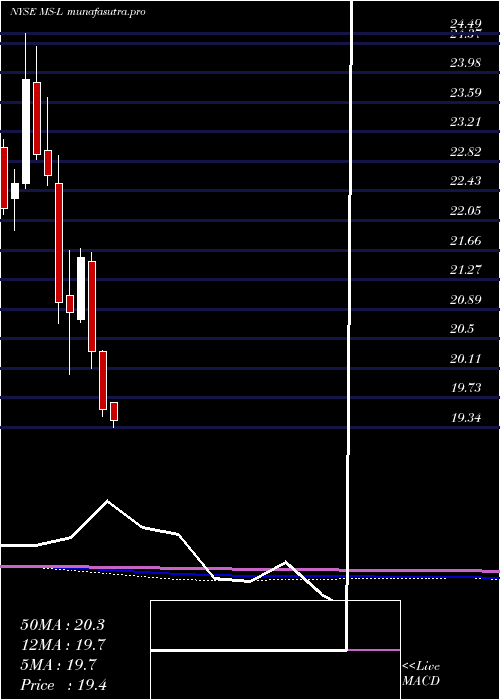
Monthly price and volumes Morgan Stanley
| Date |
Closing |
Open |
Range |
Volume |
Mon 20 October 2025 |
21.47 (0.09%) |
21.44 |
21.18 - 21.75 |
0.3779 times |
Tue 30 September 2025 |
21.45 (3.92%) |
20.47 |
20.47 - 22.28 |
0.822 times |
Fri 29 August 2025 |
20.64 (2.94%) |
20.07 |
19.99 - 20.78 |
0.9639 times |
Thu 31 July 2025 |
20.05 (1.37%) |
19.62 |
19.60 - 20.40 |
1.6349 times |
Mon 30 June 2025 |
19.78 (0.15%) |
19.69 |
19.40 - 20.15 |
0.9009 times |
Fri 30 May 2025 |
19.75 (0.92%) |
19.66 |
19.26 - 19.89 |
1.2814 times |
Wed 30 April 2025 |
19.57 (-3.74%) |
20.33 |
19.48 - 20.35 |
1.4122 times |
Mon 31 March 2025 |
20.33 (-5.71%) |
21.51 |
20.11 - 21.62 |
0.7381 times |
Fri 28 February 2025 |
21.56 (3.45%) |
20.75 |
20.71 - 21.68 |
0.707 times |
Fri 31 January 2025 |
20.84 (-0.62%) |
21.06 |
20.03 - 21.66 |
1.1618 times |
Tue 31 December 2024 |
20.97 (-7.38%) |
22.53 |
20.70 - 22.89 |
0.9084 times |
DMA SMA EMA moving averages of Morgan Stanley MS-L
DMA (daily moving average) of Morgan Stanley MS-L
| DMA period | DMA value | | 5 day DMA | 21.38 | | 12 day DMA | 21.43 | | 20 day DMA | 21.6 | | 35 day DMA | 21.57 | | 50 day DMA | 21.25 | | 100 day DMA | 20.57 | | 150 day DMA | 20.36 | | 200 day DMA | 20.54 | EMA (exponential moving average) of Morgan Stanley MS-L
| EMA period | EMA current | EMA prev | EMA prev2 | | 5 day EMA | 21.4 | 21.36 | 21.37 | | 12 day EMA | 21.45 | 21.45 | 21.47 | | 20 day EMA | 21.48 | 21.48 | 21.5 | | 35 day EMA | 21.33 | 21.32 | 21.32 | | 50 day EMA | 21.17 | 21.16 | 21.15 |
SMA (simple moving average) of Morgan Stanley MS-L
| SMA period | SMA current | SMA prev | SMA prev2 | | 5 day SMA | 21.38 | 21.35 | 21.34 | | 12 day SMA | 21.43 | 21.45 | 21.46 | | 20 day SMA | 21.6 | 21.63 | 21.68 | | 35 day SMA | 21.57 | 21.55 | 21.53 | | 50 day SMA | 21.25 | 21.22 | 21.19 | | 100 day SMA | 20.57 | 20.54 | 20.53 | | 150 day SMA | 20.36 | 20.35 | 20.35 | | 200 day SMA | 20.54 | 20.54 | 20.54 |
|
|
