MorganStanley MS-K full analysis,charts,indicators,moving averages,SMA,DMA,EMA,ADX,MACD,RSIMorgan Stanley MS-K WideScreen charts, DMA,SMA,EMA technical analysis, forecast prediction, by indicators ADX,MACD,RSI,CCI NYSE stock exchange
Daily price and charts and targets MorganStanley Strong Daily Stock price targets for MorganStanley MS-K are 24.34 and 24.44 | Daily Target 1 | 24.32 | | Daily Target 2 | 24.36 | | Daily Target 3 | 24.42 | | Daily Target 4 | 24.46 | | Daily Target 5 | 24.52 |
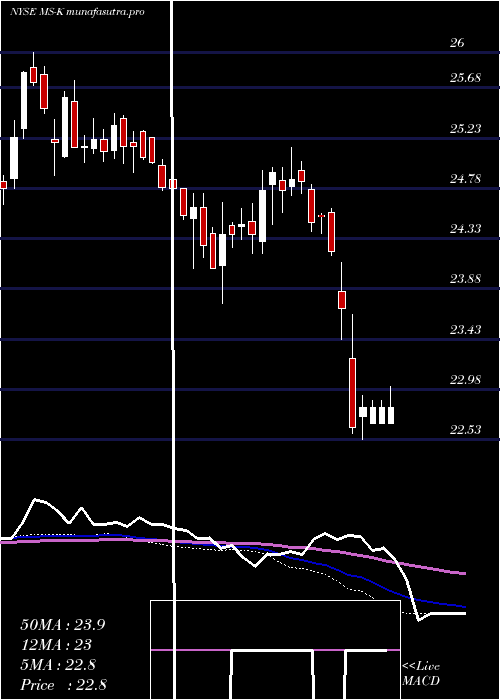
Daily price and volume Morgan Stanley
| Date |
Closing |
Open |
Range |
Volume |
Thu 04 December 2025 |
24.40 (-0.33%) |
24.43 |
24.38 - 24.48 |
1.2057 times |
Wed 03 December 2025 |
24.48 (0%) |
24.44 |
24.40 - 24.50 |
0.8969 times |
Tue 02 December 2025 |
24.48 (-0.53%) |
24.51 |
24.38 - 24.62 |
1.5814 times |
Mon 01 December 2025 |
24.61 (-0.57%) |
24.66 |
24.52 - 24.69 |
0.8871 times |
Fri 28 November 2025 |
24.75 (0.12%) |
24.75 |
24.56 - 24.75 |
0.8708 times |
Wed 26 November 2025 |
24.72 (0.45%) |
24.61 |
24.45 - 24.72 |
0.6404 times |
Tue 25 November 2025 |
24.61 (0.41%) |
24.52 |
24.46 - 24.63 |
0.8152 times |
Mon 24 November 2025 |
24.51 (0.41%) |
24.37 |
24.31 - 24.58 |
0.6649 times |
Fri 21 November 2025 |
24.41 (0.95%) |
24.27 |
24.16 - 24.43 |
0.9247 times |
Thu 20 November 2025 |
24.18 (-0.53%) |
24.33 |
24.12 - 24.36 |
1.5128 times |
Wed 19 November 2025 |
24.31 (-0.21%) |
24.27 |
24.17 - 24.35 |
0.9672 times |

Weekly price and charts MorganStanley Strong weekly Stock price targets for MorganStanley MS-K are 24.24 and 24.55 | Weekly Target 1 | 24.18 | | Weekly Target 2 | 24.29 | | Weekly Target 3 | 24.49 | | Weekly Target 4 | 24.6 | | Weekly Target 5 | 24.8 |
Weekly price and volumes for Morgan Stanley
| Date |
Closing |
Open |
Range |
Volume |
Thu 04 December 2025 |
24.40 (-1.41%) |
24.66 |
24.38 - 24.69 |
0.8835 times |
Fri 28 November 2025 |
24.75 (1.39%) |
24.37 |
24.31 - 24.75 |
0.5781 times |
Fri 21 November 2025 |
24.41 (-0.49%) |
24.54 |
24.12 - 24.54 |
2.9165 times |
Fri 14 November 2025 |
24.53 (0.86%) |
24.37 |
24.37 - 24.73 |
1.3732 times |
Fri 07 November 2025 |
24.32 (-0.29%) |
24.35 |
24.21 - 24.47 |
0.7992 times |
Fri 31 October 2025 |
24.39 (0%) |
24.65 |
24.35 - 24.70 |
0.3584 times |
Fri 31 October 2025 |
24.39 (-1.65%) |
24.91 |
24.35 - 24.99 |
0.9738 times |
Fri 24 October 2025 |
24.80 (0.61%) |
24.71 |
24.63 - 24.90 |
0.6448 times |
Fri 17 October 2025 |
24.65 (0.9%) |
24.53 |
24.36 - 24.77 |
0.5743 times |
Fri 10 October 2025 |
24.43 (-1.05%) |
24.64 |
24.36 - 24.73 |
0.8983 times |
Fri 03 October 2025 |
24.69 (-1.12%) |
24.98 |
24.48 - 25.16 |
0.8342 times |
Monthly price and charts MorganStanley Strong monthly Stock price targets for MorganStanley MS-K are 24.24 and 24.55 | Monthly Target 1 | 24.18 | | Monthly Target 2 | 24.29 | | Monthly Target 3 | 24.49 | | Monthly Target 4 | 24.6 | | Monthly Target 5 | 24.8 |
Monthly price and volumes Morgan Stanley
| Date |
Closing |
Open |
Range |
Volume |
Thu 04 December 2025 |
24.40 (-1.41%) |
24.66 |
24.38 - 24.69 |
0.1785 times |
Fri 28 November 2025 |
24.75 (1.48%) |
24.35 |
24.12 - 24.75 |
1.1448 times |
Fri 31 October 2025 |
24.39 (-0.41%) |
24.54 |
24.35 - 24.99 |
0.7569 times |
Tue 30 September 2025 |
24.49 (0.04%) |
24.39 |
24.39 - 25.53 |
0.6539 times |
Fri 29 August 2025 |
24.48 (2.77%) |
23.87 |
23.70 - 24.69 |
0.8066 times |
Thu 31 July 2025 |
23.82 (1.79%) |
23.46 |
23.42 - 24.31 |
1.1199 times |
Mon 30 June 2025 |
23.40 (1.74%) |
22.98 |
22.80 - 23.92 |
1.1746 times |
Fri 30 May 2025 |
23.00 (1.32%) |
22.76 |
22.55 - 23.25 |
1.5037 times |
Wed 30 April 2025 |
22.70 (-4.42%) |
23.83 |
22.53 - 24.12 |
1.6609 times |
Mon 31 March 2025 |
23.75 (-4.47%) |
24.94 |
23.65 - 25.02 |
1.0002 times |
Fri 28 February 2025 |
24.86 (2.01%) |
24.31 |
24.20 - 25.15 |
0.8488 times |

DMA SMA EMA moving averages of Morgan Stanley MS-K
DMA (daily moving average) of Morgan Stanley MS-K
| DMA period | DMA value | | 5 day DMA | 24.54 | | 12 day DMA | 24.49 | | 20 day DMA | 24.49 | | 35 day DMA | 24.56 | | 50 day DMA | 24.61 | | 100 day DMA | 24.52 | | 150 day DMA | 24.1 | | 200 day DMA | 24.07 | EMA (exponential moving average) of Morgan Stanley MS-K
| EMA period | EMA current | EMA prev | EMA prev2 | | 5 day EMA | 24.49 | 24.54 | 24.57 | | 12 day EMA | 24.52 | 24.54 | 24.55 | | 20 day EMA | 24.52 | 24.53 | 24.53 | | 35 day EMA | 24.58 | 24.59 | 24.6 | | 50 day EMA | 24.65 | 24.66 | 24.67 |
SMA (simple moving average) of Morgan Stanley MS-K
| SMA period | SMA current | SMA prev | SMA prev2 | | 5 day SMA | 24.54 | 24.61 | 24.63 | | 12 day SMA | 24.49 | 24.49 | 24.49 | | 20 day SMA | 24.49 | 24.49 | 24.48 | | 35 day SMA | 24.56 | 24.57 | 24.57 | | 50 day SMA | 24.61 | 24.62 | 24.64 | | 100 day SMA | 24.52 | 24.52 | 24.51 | | 150 day SMA | 24.1 | 24.09 | 24.08 | | 200 day SMA | 24.07 | 24.07 | 24.07 |
|
|
