MorganStanley MS-F full analysis,charts,indicators,moving averages,SMA,DMA,EMA,ADX,MACD,RSIMorgan Stanley MS-F WideScreen charts, DMA,SMA,EMA technical analysis, forecast prediction, by indicators ADX,MACD,RSI,CCI NYSE stock exchange
Daily price and charts and targets MorganStanley Strong Daily Stock price targets for MorganStanley MS-F are 25.27 and 25.33 | Daily Target 1 | 25.22 | | Daily Target 2 | 25.26 | | Daily Target 3 | 25.283333333333 | | Daily Target 4 | 25.32 | | Daily Target 5 | 25.34 |
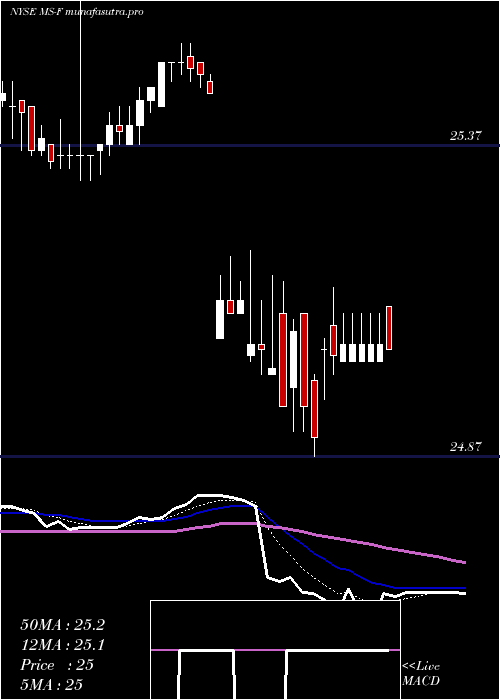
Daily price and volume Morgan Stanley
| Date |
Closing |
Open |
Range |
Volume |
Tue 21 October 2025 |
25.29 (0.08%) |
25.28 |
25.25 - 25.31 |
1.2118 times |
Mon 20 October 2025 |
25.27 (0.08%) |
25.26 |
25.25 - 25.29 |
1.293 times |
Fri 17 October 2025 |
25.25 (-0.04%) |
25.27 |
25.25 - 25.28 |
1.3026 times |
Thu 16 October 2025 |
25.26 (-0.16%) |
25.30 |
25.24 - 25.30 |
0.8748 times |
Wed 15 October 2025 |
25.30 (0.16%) |
25.28 |
25.27 - 25.30 |
0.6764 times |
Tue 14 October 2025 |
25.26 (-0.04%) |
25.27 |
25.23 - 25.27 |
0.8126 times |
Mon 13 October 2025 |
25.27 (0.04%) |
25.28 |
25.25 - 25.28 |
0.8007 times |
Fri 10 October 2025 |
25.26 (-0.12%) |
25.27 |
25.25 - 25.29 |
1.1162 times |
Thu 09 October 2025 |
25.29 (0.36%) |
25.21 |
25.20 - 25.29 |
0.999 times |
Wed 08 October 2025 |
25.20 (-0.12%) |
25.24 |
25.20 - 25.25 |
0.913 times |
Tue 07 October 2025 |
25.23 (-0.08%) |
25.26 |
25.19 - 25.28 |
1.8977 times |
Weekly price and charts MorganStanley Strong weekly Stock price targets for MorganStanley MS-F are 25.27 and 25.33 | Weekly Target 1 | 25.22 | | Weekly Target 2 | 25.26 | | Weekly Target 3 | 25.283333333333 | | Weekly Target 4 | 25.32 | | Weekly Target 5 | 25.34 |
Weekly price and volumes for Morgan Stanley
| Date |
Closing |
Open |
Range |
Volume |
Tue 21 October 2025 |
25.29 (0.16%) |
25.26 |
25.25 - 25.31 |
0.4662 times |
Fri 17 October 2025 |
25.25 (-0.04%) |
25.28 |
25.23 - 25.30 |
0.8314 times |
Fri 10 October 2025 |
25.26 (0.04%) |
25.23 |
25.19 - 25.29 |
1.1557 times |
Fri 03 October 2025 |
25.25 (-1.06%) |
25.55 |
25.10 - 25.62 |
1.7829 times |
Fri 26 September 2025 |
25.52 (-0.35%) |
25.61 |
25.46 - 25.62 |
1.5391 times |
Fri 19 September 2025 |
25.61 (0.47%) |
25.54 |
25.49 - 25.61 |
0.8545 times |
Fri 12 September 2025 |
25.49 (0.12%) |
25.47 |
25.45 - 25.57 |
1.008 times |
Fri 05 September 2025 |
25.46 (0.39%) |
25.41 |
25.37 - 25.47 |
1.2963 times |
Fri 29 August 2025 |
25.36 (0%) |
25.39 |
25.35 - 25.40 |
0.3234 times |
Fri 29 August 2025 |
25.36 (-0.12%) |
25.43 |
25.35 - 25.51 |
0.7424 times |
Fri 22 August 2025 |
25.39 (0%) |
25.38 |
25.35 - 25.52 |
0.9422 times |

Monthly price and charts MorganStanley Strong monthly Stock price targets for MorganStanley MS-F are 25.22 and 25.38 | Monthly Target 1 | 25.09 | | Monthly Target 2 | 25.19 | | Monthly Target 3 | 25.25 | | Monthly Target 4 | 25.35 | | Monthly Target 5 | 25.41 |
Monthly price and volumes Morgan Stanley
| Date |
Closing |
Open |
Range |
Volume |
Tue 21 October 2025 |
25.29 (0.56%) |
25.16 |
25.15 - 25.31 |
0.6117 times |
Tue 30 September 2025 |
25.15 (-0.83%) |
25.41 |
25.10 - 25.62 |
1.102 times |
Fri 29 August 2025 |
25.36 (0.44%) |
25.32 |
25.15 - 25.52 |
0.6018 times |
Thu 31 July 2025 |
25.25 (0.48%) |
25.14 |
25.13 - 25.39 |
0.8068 times |
Mon 30 June 2025 |
25.13 (-0.79%) |
25.34 |
25.05 - 25.55 |
0.9514 times |
Fri 30 May 2025 |
25.33 (0.92%) |
25.11 |
25.07 - 25.34 |
0.7865 times |
Wed 30 April 2025 |
25.10 (-0.08%) |
25.12 |
24.87 - 25.20 |
1.0743 times |
Mon 31 March 2025 |
25.12 (-0.95%) |
25.36 |
25.06 - 25.63 |
1.4101 times |
Fri 28 February 2025 |
25.36 (-0.04%) |
25.35 |
25.26 - 25.48 |
1.029 times |
Fri 31 January 2025 |
25.37 (0.71%) |
25.18 |
25.08 - 25.51 |
1.6264 times |
Tue 31 December 2024 |
25.19 (-0.47%) |
25.38 |
25.06 - 25.52 |
1.0808 times |

DMA SMA EMA moving averages of Morgan Stanley MS-F
DMA (daily moving average) of Morgan Stanley MS-F
| DMA period | DMA value | | 5 day DMA | 25.27 | | 12 day DMA | 25.26 | | 20 day DMA | 25.33 | | 35 day DMA | 25.4 | | 50 day DMA | 25.4 | | 100 day DMA | 25.35 | | 150 day DMA | 25.29 | | 200 day DMA | 25.3 | EMA (exponential moving average) of Morgan Stanley MS-F
| EMA period | EMA current | EMA prev | EMA prev2 | | 5 day EMA | 25.27 | 25.26 | 25.26 | | 12 day EMA | 25.28 | 25.28 | 25.28 | | 20 day EMA | 25.31 | 25.31 | 25.31 | | 35 day EMA | 25.33 | 25.33 | 25.33 | | 50 day EMA | 25.38 | 25.38 | 25.38 |
SMA (simple moving average) of Morgan Stanley MS-F
| SMA period | SMA current | SMA prev | SMA prev2 | | 5 day SMA | 25.27 | 25.27 | 25.27 | | 12 day SMA | 25.26 | 25.26 | 25.25 | | 20 day SMA | 25.33 | 25.34 | 25.36 | | 35 day SMA | 25.4 | 25.4 | 25.4 | | 50 day SMA | 25.4 | 25.4 | 25.4 | | 100 day SMA | 25.35 | 25.35 | 25.35 | | 150 day SMA | 25.29 | 25.29 | 25.29 | | 200 day SMA | 25.3 | 25.3 | 25.3 |
|
|
