MorganStanley MS-A full analysis,charts,indicators,moving averages,SMA,DMA,EMA,ADX,MACD,RSIMorgan Stanley MS-A WideScreen charts, DMA,SMA,EMA technical analysis, forecast prediction, by indicators ADX,MACD,RSI,CCI NYSE stock exchange
Daily price and charts and targets MorganStanley Strong Daily Stock price targets for MorganStanley MS-A are 19.7 and 19.85 | Daily Target 1 | 19.58 | | Daily Target 2 | 19.67 | | Daily Target 3 | 19.733333333333 | | Daily Target 4 | 19.82 | | Daily Target 5 | 19.88 |
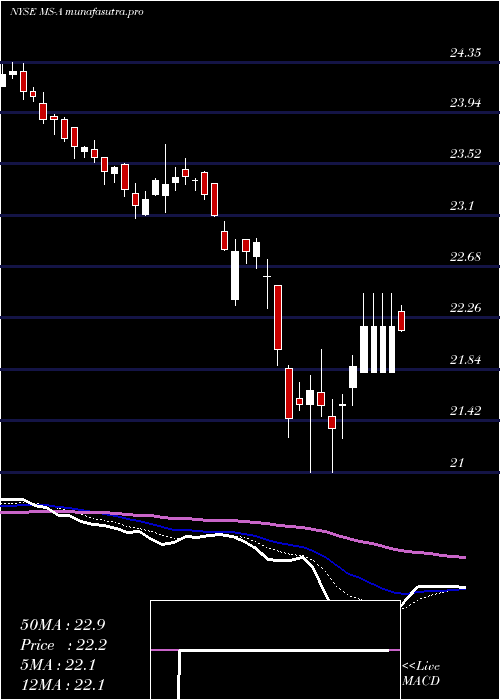
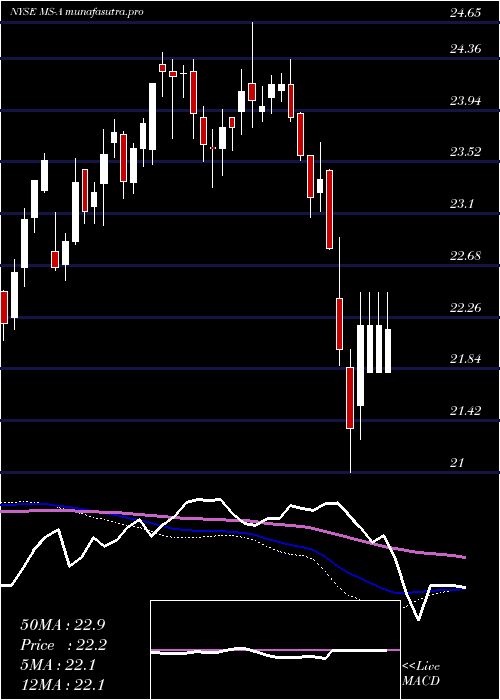
Daily price and volume Morgan Stanley
| Date |
Closing |
Open |
Range |
Volume |
Fri 05 December 2025 |
19.75 (0%) |
19.69 |
19.65 - 19.80 |
0.7712 times |
Thu 04 December 2025 |
19.75 (-0.7%) |
19.92 |
19.63 - 20.14 |
1.9306 times |
Wed 03 December 2025 |
19.89 (1.02%) |
19.72 |
19.62 - 19.90 |
0.9511 times |
Tue 02 December 2025 |
19.69 (-0.05%) |
19.67 |
19.66 - 19.86 |
1.2027 times |
Mon 01 December 2025 |
19.70 (0%) |
19.60 |
19.55 - 19.81 |
0.8064 times |
Fri 28 November 2025 |
19.70 (0.51%) |
19.60 |
19.49 - 19.70 |
0.7316 times |
Wed 26 November 2025 |
19.60 (0.2%) |
19.60 |
19.50 - 19.70 |
0.9486 times |
Tue 25 November 2025 |
19.56 (-0.2%) |
19.60 |
19.38 - 19.60 |
1.0178 times |
Mon 24 November 2025 |
19.60 (0.2%) |
19.58 |
19.55 - 19.80 |
0.7712 times |
Fri 21 November 2025 |
19.56 (-0.15%) |
19.51 |
19.28 - 19.72 |
0.8687 times |
Thu 20 November 2025 |
19.59 (-1.9%) |
20.01 |
19.41 - 20.08 |
1.4437 times |
Weekly price and charts MorganStanley Strong weekly Stock price targets for MorganStanley MS-A are 19.65 and 20.24 | Weekly Target 1 | 19.22 | | Weekly Target 2 | 19.49 | | Weekly Target 3 | 19.813333333333 | | Weekly Target 4 | 20.08 | | Weekly Target 5 | 20.4 |
Weekly price and volumes for Morgan Stanley
| Date |
Closing |
Open |
Range |
Volume |
Fri 05 December 2025 |
19.75 (0.25%) |
19.60 |
19.55 - 20.14 |
1.9155 times |
Fri 28 November 2025 |
19.70 (0.72%) |
19.58 |
19.38 - 19.80 |
1.1736 times |
Fri 21 November 2025 |
19.56 (-3.88%) |
20.28 |
19.28 - 20.39 |
1.6352 times |
Fri 14 November 2025 |
20.35 (-1.69%) |
20.76 |
20.20 - 21.00 |
1.0506 times |
Fri 07 November 2025 |
20.70 (-1.24%) |
20.84 |
20.58 - 21.01 |
0.8323 times |
Fri 31 October 2025 |
20.96 (0%) |
21.00 |
20.83 - 21.06 |
0.2475 times |
Fri 31 October 2025 |
20.96 (0%) |
20.94 |
20.83 - 21.19 |
0.8838 times |
Fri 24 October 2025 |
20.96 (0.72%) |
20.87 |
20.81 - 21.13 |
0.6252 times |
Fri 17 October 2025 |
20.81 (-0.24%) |
21.01 |
20.60 - 21.18 |
0.9806 times |
Fri 10 October 2025 |
20.86 (-2.84%) |
21.52 |
20.80 - 21.55 |
0.6557 times |
Fri 03 October 2025 |
21.47 (-3.42%) |
22.29 |
21.31 - 22.34 |
0.957 times |
Monthly price and charts MorganStanley Strong monthly Stock price targets for MorganStanley MS-A are 19.65 and 20.24 | Monthly Target 1 | 19.22 | | Monthly Target 2 | 19.49 | | Monthly Target 3 | 19.813333333333 | | Monthly Target 4 | 20.08 | | Monthly Target 5 | 20.4 |
Monthly price and volumes Morgan Stanley
| Date |
Closing |
Open |
Range |
Volume |
Fri 05 December 2025 |
19.75 (0.25%) |
19.60 |
19.55 - 20.14 |
0.6691 times |
Fri 28 November 2025 |
19.70 (-6.01%) |
20.84 |
19.28 - 21.01 |
1.6389 times |
Fri 31 October 2025 |
20.96 (-2.1%) |
21.46 |
20.60 - 21.67 |
1.291 times |
Tue 30 September 2025 |
21.41 (-1.79%) |
21.85 |
21.31 - 22.57 |
0.9549 times |
Fri 29 August 2025 |
21.80 (0%) |
21.89 |
21.75 - 22.65 |
0.8293 times |
Thu 31 July 2025 |
21.80 (2.2%) |
21.46 |
21.28 - 22.50 |
0.8408 times |
Mon 30 June 2025 |
21.33 (-3.75%) |
22.11 |
21.11 - 22.50 |
1.0058 times |
Fri 30 May 2025 |
22.16 (-1.07%) |
22.43 |
20.50 - 22.59 |
1.0461 times |
Wed 30 April 2025 |
22.40 (-1.75%) |
22.90 |
21.00 - 22.91 |
1.0134 times |
Mon 31 March 2025 |
22.80 (-4.52%) |
23.91 |
22.36 - 23.92 |
0.7106 times |
Fri 28 February 2025 |
23.88 (-0.58%) |
23.93 |
23.85 - 24.35 |
0.5911 times |

DMA SMA EMA moving averages of Morgan Stanley MS-A
DMA (daily moving average) of Morgan Stanley MS-A
| DMA period | DMA value | | 5 day DMA | 19.76 | | 12 day DMA | 19.7 | | 20 day DMA | 20.01 | | 35 day DMA | 20.41 | | 50 day DMA | 20.7 | | 100 day DMA | 21.36 | | 150 day DMA | 21.51 | | 200 day DMA | 21.86 | EMA (exponential moving average) of Morgan Stanley MS-A
| EMA period | EMA current | EMA prev | EMA prev2 | | 5 day EMA | 19.76 | 19.76 | 19.76 | | 12 day EMA | 19.83 | 19.84 | 19.86 | | 20 day EMA | 20.01 | 20.04 | 20.07 | | 35 day EMA | 20.34 | 20.38 | 20.42 | | 50 day EMA | 20.73 | 20.77 | 20.81 |
SMA (simple moving average) of Morgan Stanley MS-A
| SMA period | SMA current | SMA prev | SMA prev2 | | 5 day SMA | 19.76 | 19.75 | 19.72 | | 12 day SMA | 19.7 | 19.74 | 19.78 | | 20 day SMA | 20.01 | 20.06 | 20.11 | | 35 day SMA | 20.41 | 20.45 | 20.48 | | 50 day SMA | 20.7 | 20.75 | 20.8 | | 100 day SMA | 21.36 | 21.38 | 21.4 | | 150 day SMA | 21.51 | 21.52 | 21.54 | | 200 day SMA | 21.86 | 21.88 | 21.9 |
|
|
