BlackrockMuniyield MQY full analysis,charts,indicators,moving averages,SMA,DMA,EMA,ADX,MACD,RSIBlackrock Muniyield MQY WideScreen charts, DMA,SMA,EMA technical analysis, forecast prediction, by indicators ADX,MACD,RSI,CCI NYSE stock exchange
operates under N A sector & deals in N A
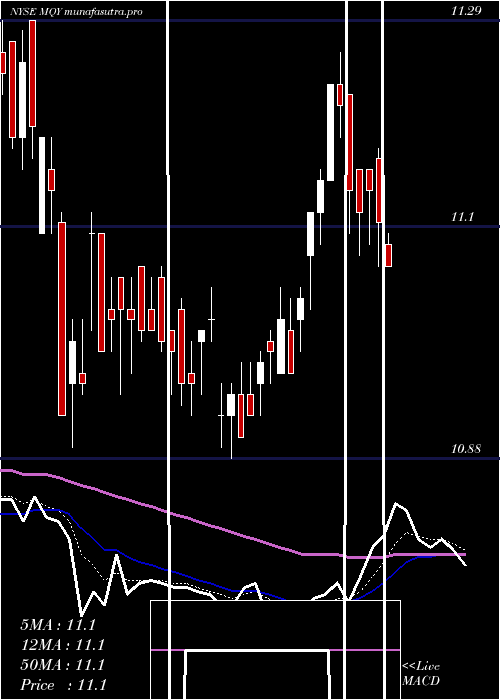
Daily price and charts and targets BlackrockMuniyield Strong Daily Stock price targets for BlackrockMuniyield MQY are 11.4 and 11.52 | Daily Target 1 | 11.36 | | Daily Target 2 | 11.41 | | Daily Target 3 | 11.48 | | Daily Target 4 | 11.53 | | Daily Target 5 | 11.6 |
Daily price and volume Blackrock Muniyield
| Date |
Closing |
Open |
Range |
Volume |
Thu 04 December 2025 |
11.46 (0.17%) |
11.46 |
11.43 - 11.55 |
1.2161 times |
Wed 03 December 2025 |
11.44 (0.79%) |
11.35 |
11.34 - 11.50 |
2.1097 times |
Tue 02 December 2025 |
11.35 (-0.26%) |
11.38 |
11.30 - 11.38 |
1.2598 times |
Mon 01 December 2025 |
11.38 (-0.26%) |
11.34 |
11.34 - 11.40 |
0.8613 times |
Fri 28 November 2025 |
11.41 (0.35%) |
11.39 |
11.36 - 11.42 |
0.2892 times |
Wed 26 November 2025 |
11.37 (0.26%) |
11.33 |
11.30 - 11.39 |
0.8575 times |
Tue 25 November 2025 |
11.34 (0.44%) |
11.29 |
11.28 - 11.36 |
1 times |
Mon 24 November 2025 |
11.29 (0.18%) |
11.31 |
11.25 - 11.31 |
0.592 times |
Fri 21 November 2025 |
11.27 (-0.53%) |
11.36 |
11.16 - 11.36 |
1.2306 times |
Thu 20 November 2025 |
11.33 (-0.44%) |
11.36 |
11.32 - 11.38 |
0.5838 times |
Wed 19 November 2025 |
11.38 (-0.52%) |
11.45 |
11.37 - 11.45 |
0.6893 times |
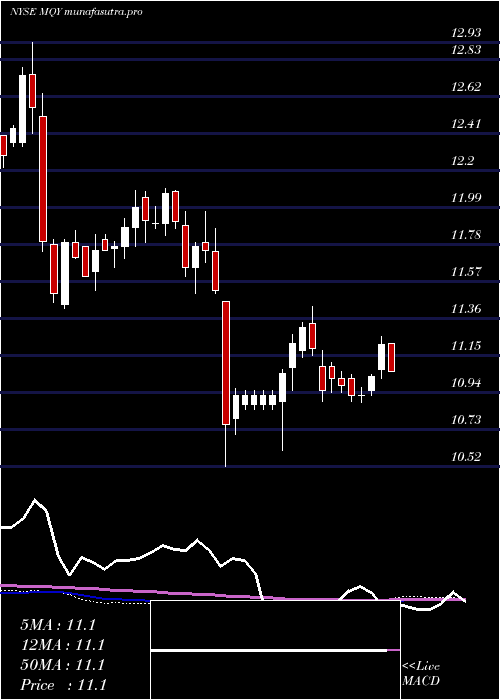
Weekly price and charts BlackrockMuniyield Strong weekly Stock price targets for BlackrockMuniyield MQY are 11.38 and 11.63 | Weekly Target 1 | 11.19 | | Weekly Target 2 | 11.32 | | Weekly Target 3 | 11.436666666667 | | Weekly Target 4 | 11.57 | | Weekly Target 5 | 11.69 |
Weekly price and volumes for Blackrock Muniyield
| Date |
Closing |
Open |
Range |
Volume |
Thu 04 December 2025 |
11.46 (0.44%) |
11.34 |
11.30 - 11.55 |
1.8289 times |
Fri 28 November 2025 |
11.41 (1.24%) |
11.31 |
11.25 - 11.42 |
0.9196 times |
Fri 21 November 2025 |
11.27 (-1.57%) |
11.46 |
11.16 - 11.50 |
1.1765 times |
Fri 14 November 2025 |
11.45 (-0.43%) |
11.49 |
11.43 - 11.62 |
0.8506 times |
Fri 07 November 2025 |
11.50 (-1.29%) |
11.56 |
11.46 - 11.65 |
0.8478 times |
Fri 31 October 2025 |
11.65 (0%) |
11.58 |
11.58 - 11.65 |
0.2046 times |
Fri 31 October 2025 |
11.65 (-0.17%) |
11.67 |
11.57 - 11.69 |
1.2452 times |
Fri 24 October 2025 |
11.67 (1.21%) |
11.60 |
11.52 - 11.69 |
1.3373 times |
Fri 17 October 2025 |
11.53 (0%) |
11.65 |
11.47 - 11.73 |
1.2576 times |
Tue 07 October 2025 |
11.53 (-0.09%) |
11.52 |
11.45 - 11.55 |
0.332 times |
Fri 03 October 2025 |
11.54 (-1.2%) |
11.77 |
11.49 - 11.77 |
1.4182 times |
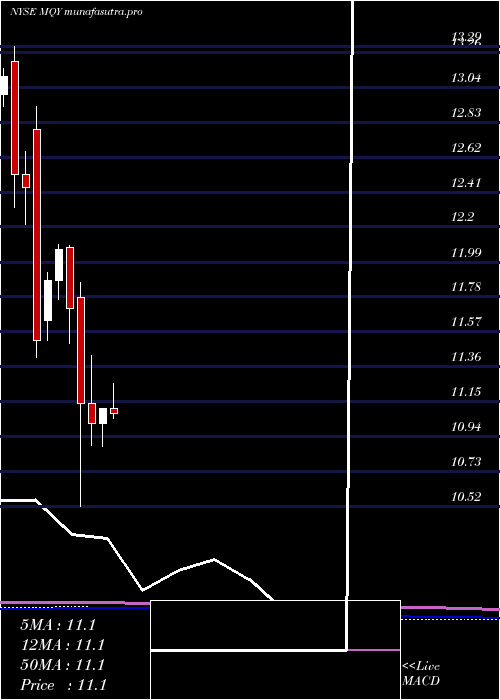
Monthly price and charts BlackrockMuniyield Strong monthly Stock price targets for BlackrockMuniyield MQY are 11.38 and 11.63 | Monthly Target 1 | 11.19 | | Monthly Target 2 | 11.32 | | Monthly Target 3 | 11.436666666667 | | Monthly Target 4 | 11.57 | | Monthly Target 5 | 11.69 |
Monthly price and volumes Blackrock Muniyield
| Date |
Closing |
Open |
Range |
Volume |
Thu 04 December 2025 |
11.46 (0.44%) |
11.34 |
11.30 - 11.55 |
0.5049 times |
Fri 28 November 2025 |
11.41 (-2.06%) |
11.56 |
11.16 - 11.65 |
1.0475 times |
Fri 31 October 2025 |
11.65 (0%) |
11.71 |
11.45 - 11.74 |
1.4871 times |
Tue 30 September 2025 |
11.65 (5.24%) |
11.05 |
11.00 - 11.91 |
1.2137 times |
Fri 29 August 2025 |
11.07 (1%) |
11.02 |
10.85 - 11.24 |
1.008 times |
Thu 31 July 2025 |
10.96 (-1.35%) |
11.11 |
10.78 - 11.26 |
0.778 times |
Mon 30 June 2025 |
11.11 (0.82%) |
11.02 |
10.88 - 11.11 |
0.9537 times |
Fri 30 May 2025 |
11.02 (-1.08%) |
11.14 |
10.89 - 11.43 |
0.8715 times |
Wed 30 April 2025 |
11.14 (-4.87%) |
11.78 |
10.52 - 11.87 |
1.2513 times |
Mon 31 March 2025 |
11.71 (-2.98%) |
12.08 |
11.50 - 12.09 |
0.8844 times |
Fri 28 February 2025 |
12.07 (1.6%) |
11.88 |
11.77 - 12.10 |
0.9866 times |
DMA SMA EMA moving averages of Blackrock Muniyield MQY
DMA (daily moving average) of Blackrock Muniyield MQY
| DMA period | DMA value | | 5 day DMA | 11.41 | | 12 day DMA | 11.37 | | 20 day DMA | 11.43 | | 35 day DMA | 11.51 | | 50 day DMA | 11.56 | | 100 day DMA | 11.34 | | 150 day DMA | 11.25 | | 200 day DMA | 11.32 | EMA (exponential moving average) of Blackrock Muniyield MQY
| EMA period | EMA current | EMA prev | EMA prev2 | | 5 day EMA | 11.41 | 11.39 | 11.36 | | 12 day EMA | 11.41 | 11.4 | 11.39 | | 20 day EMA | 11.44 | 11.44 | 11.44 | | 35 day EMA | 11.49 | 11.49 | 11.49 | | 50 day EMA | 11.56 | 11.56 | 11.57 |
SMA (simple moving average) of Blackrock Muniyield MQY
| SMA period | SMA current | SMA prev | SMA prev2 | | 5 day SMA | 11.41 | 11.39 | 11.37 | | 12 day SMA | 11.37 | 11.37 | 11.37 | | 20 day SMA | 11.43 | 11.44 | 11.44 | | 35 day SMA | 11.51 | 11.52 | 11.52 | | 50 day SMA | 11.56 | 11.56 | 11.57 | | 100 day SMA | 11.34 | 11.34 | 11.33 | | 150 day SMA | 11.25 | 11.25 | 11.25 | | 200 day SMA | 11.32 | 11.32 | 11.32 |
|
|
