BlackrockMuniyield MQT full analysis,charts,indicators,moving averages,SMA,DMA,EMA,ADX,MACD,RSIBlackrock Muniyield MQT WideScreen charts, DMA,SMA,EMA technical analysis, forecast prediction, by indicators ADX,MACD,RSI,CCI NYSE stock exchange
operates under N A sector & deals in N A
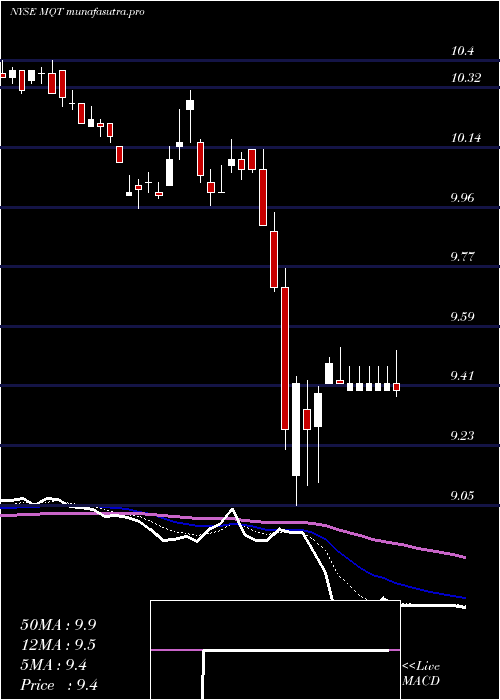
Daily price and charts and targets BlackrockMuniyield Strong Daily Stock price targets for BlackrockMuniyield MQT are 9.97 and 10.06 | Daily Target 1 | 9.89 | | Daily Target 2 | 9.95 | | Daily Target 3 | 9.9833333333333 | | Daily Target 4 | 10.04 | | Daily Target 5 | 10.07 |
Daily price and volume Blackrock Muniyield
| Date |
Closing |
Open |
Range |
Volume |
Thu 04 December 2025 |
10.00 (0.1%) |
9.96 |
9.93 - 10.02 |
0.8702 times |
Wed 03 December 2025 |
9.99 (0.91%) |
9.89 |
9.89 - 9.99 |
2.4739 times |
Tue 02 December 2025 |
9.90 (-0.2%) |
9.91 |
9.88 - 9.93 |
1.7806 times |
Mon 01 December 2025 |
9.92 (-0.5%) |
9.91 |
9.91 - 9.97 |
1.1581 times |
Fri 28 November 2025 |
9.97 (0.2%) |
9.94 |
9.94 - 9.97 |
0.222 times |
Wed 26 November 2025 |
9.95 (0.2%) |
9.91 |
9.91 - 9.98 |
1.1227 times |
Tue 25 November 2025 |
9.93 (0%) |
9.93 |
9.90 - 9.97 |
0.8734 times |
Mon 24 November 2025 |
9.93 (0.1%) |
9.90 |
9.88 - 9.94 |
0.4536 times |
Fri 21 November 2025 |
9.92 (0.2%) |
9.90 |
9.89 - 9.92 |
0.3313 times |
Thu 20 November 2025 |
9.90 (-0.9%) |
9.97 |
9.90 - 10.01 |
0.7142 times |
Wed 19 November 2025 |
9.99 (-0.1%) |
10.00 |
9.97 - 10.05 |
0.4568 times |
Weekly price and charts BlackrockMuniyield Strong weekly Stock price targets for BlackrockMuniyield MQT are 9.94 and 10.08 | Weekly Target 1 | 9.83 | | Weekly Target 2 | 9.91 | | Weekly Target 3 | 9.9666666666667 | | Weekly Target 4 | 10.05 | | Weekly Target 5 | 10.11 |
Weekly price and volumes for Blackrock Muniyield
| Date |
Closing |
Open |
Range |
Volume |
Thu 04 December 2025 |
10.00 (0.3%) |
9.91 |
9.88 - 10.02 |
1.3381 times |
Fri 28 November 2025 |
9.97 (0.5%) |
9.90 |
9.88 - 9.98 |
0.569 times |
Fri 21 November 2025 |
9.92 (-1.29%) |
10.07 |
9.89 - 10.07 |
0.6129 times |
Fri 14 November 2025 |
10.05 (0.1%) |
10.02 |
10.02 - 10.20 |
0.8976 times |
Fri 07 November 2025 |
10.04 (0.1%) |
10.01 |
9.99 - 10.09 |
1.0141 times |
Fri 31 October 2025 |
10.03 (0%) |
9.98 |
9.98 - 10.04 |
0.5242 times |
Fri 31 October 2025 |
10.03 (-0.5%) |
10.08 |
9.95 - 10.13 |
2.0439 times |
Fri 24 October 2025 |
10.08 (0.1%) |
10.09 |
10.01 - 10.17 |
1.4419 times |
Fri 17 October 2025 |
10.07 (0.2%) |
10.15 |
10.04 - 10.25 |
1.2724 times |
Tue 07 October 2025 |
10.05 (0.1%) |
10.03 |
10.03 - 10.08 |
0.286 times |
Fri 03 October 2025 |
10.04 (0.3%) |
10.02 |
10.02 - 10.17 |
0.7406 times |

Monthly price and charts BlackrockMuniyield Strong monthly Stock price targets for BlackrockMuniyield MQT are 9.94 and 10.08 | Monthly Target 1 | 9.83 | | Monthly Target 2 | 9.91 | | Monthly Target 3 | 9.9666666666667 | | Monthly Target 4 | 10.05 | | Monthly Target 5 | 10.11 |
Monthly price and volumes Blackrock Muniyield
| Date |
Closing |
Open |
Range |
Volume |
Thu 04 December 2025 |
10.00 (0.3%) |
9.91 |
9.88 - 10.02 |
0.3493 times |
Fri 28 November 2025 |
9.97 (-0.6%) |
10.01 |
9.88 - 10.20 |
0.8076 times |
Fri 31 October 2025 |
10.03 (0%) |
10.06 |
9.95 - 10.25 |
1.5797 times |
Tue 30 September 2025 |
10.03 (4.59%) |
9.52 |
9.52 - 10.18 |
1.1578 times |
Fri 29 August 2025 |
9.59 (1.59%) |
9.45 |
9.39 - 9.65 |
1.2289 times |
Thu 31 July 2025 |
9.44 (-2.07%) |
9.65 |
9.32 - 9.81 |
0.7818 times |
Mon 30 June 2025 |
9.64 (0.84%) |
9.55 |
9.45 - 9.65 |
0.9126 times |
Fri 30 May 2025 |
9.56 (-1.75%) |
9.76 |
9.50 - 9.96 |
0.6857 times |
Wed 30 April 2025 |
9.73 (-2.7%) |
10.08 |
9.05 - 10.16 |
1.6829 times |
Mon 31 March 2025 |
10.00 (-3.57%) |
10.36 |
9.95 - 10.40 |
0.8136 times |
Fri 28 February 2025 |
10.37 (1.87%) |
10.20 |
10.05 - 10.40 |
0.9254 times |

DMA SMA EMA moving averages of Blackrock Muniyield MQT
DMA (daily moving average) of Blackrock Muniyield MQT
| DMA period | DMA value | | 5 day DMA | 9.96 | | 12 day DMA | 9.95 | | 20 day DMA | 10 | | 35 day DMA | 10.03 | | 50 day DMA | 10.05 | | 100 day DMA | 9.84 | | 150 day DMA | 9.77 | | 200 day DMA | 9.81 | EMA (exponential moving average) of Blackrock Muniyield MQT
| EMA period | EMA current | EMA prev | EMA prev2 | | 5 day EMA | 9.97 | 9.95 | 9.93 | | 12 day EMA | 9.97 | 9.96 | 9.96 | | 20 day EMA | 9.99 | 9.99 | 9.99 | | 35 day EMA | 10.01 | 10.01 | 10.01 | | 50 day EMA | 10.05 | 10.05 | 10.05 |
SMA (simple moving average) of Blackrock Muniyield MQT
| SMA period | SMA current | SMA prev | SMA prev2 | | 5 day SMA | 9.96 | 9.95 | 9.93 | | 12 day SMA | 9.95 | 9.95 | 9.96 | | 20 day SMA | 10 | 10.01 | 10.01 | | 35 day SMA | 10.03 | 10.03 | 10.04 | | 50 day SMA | 10.05 | 10.05 | 10.05 | | 100 day SMA | 9.84 | 9.83 | 9.83 | | 150 day SMA | 9.77 | 9.77 | 9.77 | | 200 day SMA | 9.81 | 9.81 | 9.81 |
|
|
