MarathonPetroleum MPC full analysis,charts,indicators,moving averages,SMA,DMA,EMA,ADX,MACD,RSIMarathon Petroleum MPC WideScreen charts, DMA,SMA,EMA technical analysis, forecast prediction, by indicators ADX,MACD,RSI,CCI NYSE stock exchange
operates under Energy sector & deals in Integrated Oil Companies
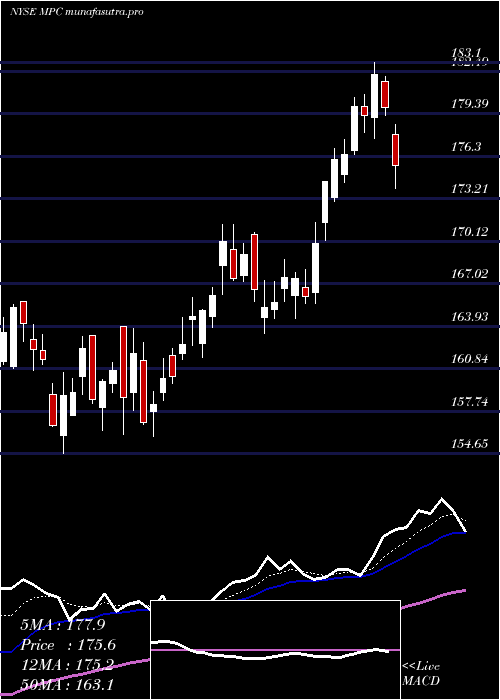
Daily price and charts and targets MarathonPetroleum Strong Daily Stock price targets for MarathonPetroleum MPC are 190.22 and 193.84 | Daily Target 1 | 187.7 | | Daily Target 2 | 189.12 | | Daily Target 3 | 191.32333333333 | | Daily Target 4 | 192.74 | | Daily Target 5 | 194.94 |
Daily price and volume Marathon Petroleum
| Date |
Closing |
Open |
Range |
Volume |
Fri 05 December 2025 |
190.53 (0.17%) |
189.91 |
189.91 - 193.53 |
0.9225 times |
Thu 04 December 2025 |
190.20 (0.41%) |
188.61 |
187.64 - 191.70 |
0.6105 times |
Wed 03 December 2025 |
189.43 (-1.7%) |
193.26 |
188.46 - 194.00 |
1.5458 times |
Tue 02 December 2025 |
192.70 (-1.75%) |
197.91 |
189.77 - 197.91 |
0.5132 times |
Mon 01 December 2025 |
196.14 (1.24%) |
194.12 |
194.12 - 198.16 |
1.09 times |
Fri 28 November 2025 |
193.73 (1.04%) |
193.12 |
192.94 - 196.00 |
0.6532 times |
Wed 26 November 2025 |
191.74 (0.92%) |
189.99 |
189.75 - 193.50 |
0.8021 times |
Tue 25 November 2025 |
190.00 (-0.09%) |
188.80 |
187.14 - 191.20 |
1.0202 times |
Mon 24 November 2025 |
190.18 (-0.23%) |
189.54 |
186.45 - 191.76 |
1.621 times |
Fri 21 November 2025 |
190.62 (1.46%) |
187.89 |
186.56 - 192.07 |
1.2216 times |
Thu 20 November 2025 |
187.87 (-3.91%) |
195.62 |
187.42 - 197.96 |
1.9092 times |
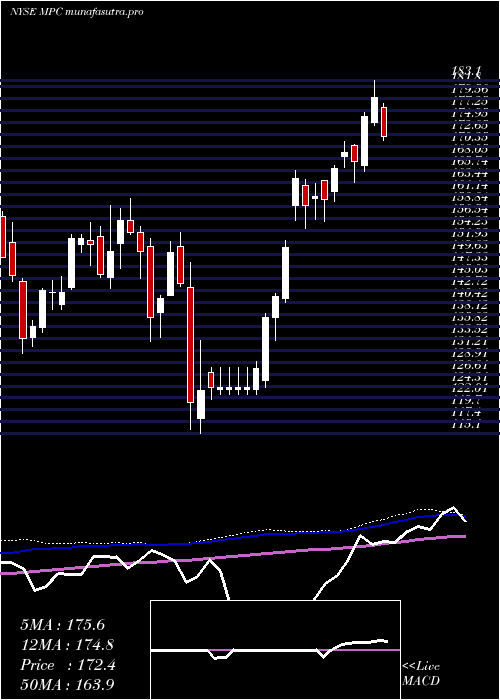
Weekly price and charts MarathonPetroleum Strong weekly Stock price targets for MarathonPetroleum MPC are 183.83 and 194.35 | Weekly Target 1 | 181.59 | | Weekly Target 2 | 186.06 | | Weekly Target 3 | 192.11 | | Weekly Target 4 | 196.58 | | Weekly Target 5 | 202.63 |
Weekly price and volumes for Marathon Petroleum
| Date |
Closing |
Open |
Range |
Volume |
Fri 05 December 2025 |
190.53 (-1.65%) |
194.12 |
187.64 - 198.16 |
1.0047 times |
Fri 28 November 2025 |
193.73 (1.63%) |
189.54 |
186.45 - 196.00 |
0.8791 times |
Fri 21 November 2025 |
190.62 (-4.68%) |
198.88 |
186.56 - 199.66 |
1.4416 times |
Fri 14 November 2025 |
199.98 (3.21%) |
193.33 |
191.55 - 202.30 |
1.3105 times |
Fri 07 November 2025 |
193.76 (-0.59%) |
179.10 |
175.00 - 197.07 |
1.8104 times |
Fri 31 October 2025 |
194.91 (0%) |
196.20 |
193.33 - 196.50 |
0.2113 times |
Fri 31 October 2025 |
194.91 (-0.67%) |
196.72 |
190.32 - 200.65 |
1.1883 times |
Fri 24 October 2025 |
196.22 (6.37%) |
184.93 |
181.79 - 198.79 |
0.8544 times |
Fri 17 October 2025 |
184.47 (-3.69%) |
183.75 |
180.32 - 186.09 |
1.032 times |
Tue 07 October 2025 |
191.54 (-0.83%) |
193.82 |
187.81 - 197.10 |
0.2677 times |
Fri 03 October 2025 |
193.14 (-2.79%) |
198.33 |
189.42 - 198.75 |
0.971 times |
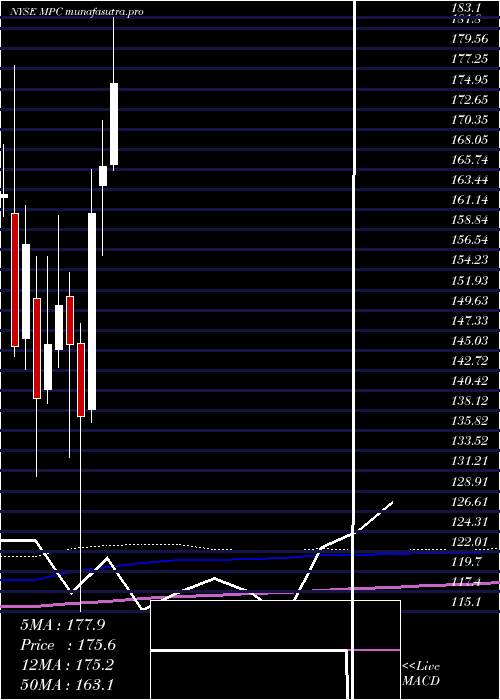
Monthly price and charts MarathonPetroleum Strong monthly Stock price targets for MarathonPetroleum MPC are 183.83 and 194.35 | Monthly Target 1 | 181.59 | | Monthly Target 2 | 186.06 | | Monthly Target 3 | 192.11 | | Monthly Target 4 | 196.58 | | Monthly Target 5 | 202.63 |
Monthly price and volumes Marathon Petroleum
| Date |
Closing |
Open |
Range |
Volume |
Fri 05 December 2025 |
190.53 (-1.65%) |
194.12 |
187.64 - 198.16 |
0.1724 times |
Fri 28 November 2025 |
193.73 (-0.61%) |
179.10 |
175.00 - 202.30 |
0.9337 times |
Fri 31 October 2025 |
194.91 (1.13%) |
192.09 |
180.32 - 200.65 |
0.7072 times |
Tue 30 September 2025 |
192.74 (7.25%) |
178.86 |
176.89 - 201.61 |
0.9818 times |
Fri 29 August 2025 |
179.71 (5.59%) |
167.80 |
158.00 - 181.43 |
0.9024 times |
Thu 31 July 2025 |
170.19 (2.46%) |
166.36 |
165.62 - 183.10 |
1.0377 times |
Mon 30 June 2025 |
166.11 (3.34%) |
163.91 |
155.93 - 171.34 |
1.2712 times |
Fri 30 May 2025 |
160.74 (16.98%) |
138.29 |
136.80 - 165.70 |
1.2617 times |
Wed 30 April 2025 |
137.41 (-5.68%) |
145.77 |
115.10 - 148.13 |
1.4138 times |
Mon 31 March 2025 |
145.69 (-2.99%) |
151.23 |
132.79 - 153.89 |
1.3182 times |
Fri 28 February 2025 |
150.18 (3.07%) |
145.15 |
143.11 - 160.45 |
1.2907 times |
DMA SMA EMA moving averages of Marathon Petroleum MPC
DMA (daily moving average) of Marathon Petroleum MPC
| DMA period | DMA value | | 5 day DMA | 191.8 | | 12 day DMA | 191.56 | | 20 day DMA | 193.8 | | 35 day DMA | 192.65 | | 50 day DMA | 192.1 | | 100 day DMA | 182.86 | | 150 day DMA | 175.78 | | 200 day DMA | 166.25 | EMA (exponential moving average) of Marathon Petroleum MPC
| EMA period | EMA current | EMA prev | EMA prev2 | | 5 day EMA | 191.1 | 191.38 | 191.97 | | 12 day EMA | 192.01 | 192.28 | 192.66 | | 20 day EMA | 192.39 | 192.59 | 192.84 | | 35 day EMA | 192.14 | 192.24 | 192.36 | | 50 day EMA | 191.47 | 191.51 | 191.56 |
SMA (simple moving average) of Marathon Petroleum MPC
| SMA period | SMA current | SMA prev | SMA prev2 | | 5 day SMA | 191.8 | 192.44 | 192.75 | | 12 day SMA | 191.56 | 192.31 | 192.79 | | 20 day SMA | 193.8 | 193.91 | 193.71 | | 35 day SMA | 192.65 | 192.38 | 192.2 | | 50 day SMA | 192.1 | 192.04 | 191.94 | | 100 day SMA | 182.86 | 182.75 | 182.67 | | 150 day SMA | 175.78 | 175.42 | 175.07 | | 200 day SMA | 166.25 | 166.09 | 165.92 |
|
|
