BlackrockMuniyield MPA full analysis,charts,indicators,moving averages,SMA,DMA,EMA,ADX,MACD,RSIBlackrock Muniyield MPA WideScreen charts, DMA,SMA,EMA technical analysis, forecast prediction, by indicators ADX,MACD,RSI,CCI NYSE stock exchange
operates under N A sector & deals in N A
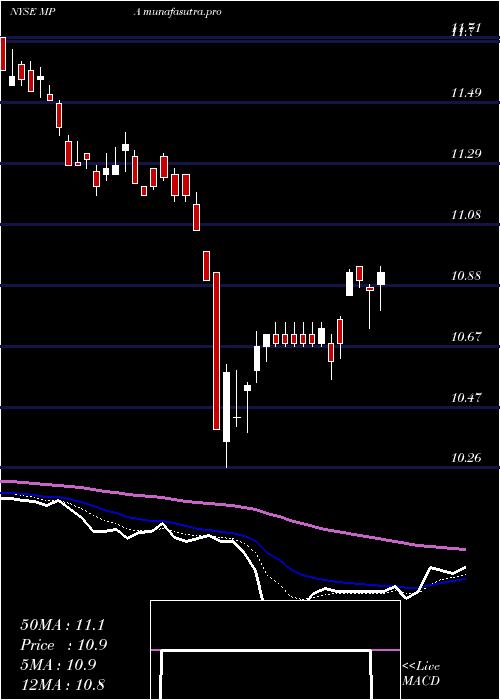
Daily price and charts and targets BlackrockMuniyield Strong Daily Stock price targets for BlackrockMuniyield MPA are 11.26 and 11.32 | Daily Target 1 | 11.21 | | Daily Target 2 | 11.24 | | Daily Target 3 | 11.27 | | Daily Target 4 | 11.3 | | Daily Target 5 | 11.33 |
Daily price and volume Blackrock Muniyield
| Date |
Closing |
Open |
Range |
Volume |
Thu 04 December 2025 |
11.27 (-0.35%) |
11.24 |
11.24 - 11.30 |
0.6906 times |
Wed 03 December 2025 |
11.31 (0.8%) |
11.21 |
11.15 - 11.31 |
2.5478 times |
Tue 02 December 2025 |
11.22 (0.09%) |
11.22 |
11.16 - 11.25 |
1.2753 times |
Mon 01 December 2025 |
11.21 (-0.8%) |
11.21 |
11.20 - 11.27 |
1.2842 times |
Fri 28 November 2025 |
11.30 (0.27%) |
11.30 |
11.24 - 11.30 |
0.5319 times |
Wed 26 November 2025 |
11.27 (0.36%) |
11.28 |
11.20 - 11.28 |
0.6553 times |
Tue 25 November 2025 |
11.23 (0.09%) |
11.19 |
11.19 - 11.27 |
0.764 times |
Mon 24 November 2025 |
11.22 (0.63%) |
11.20 |
11.13 - 11.22 |
0.5525 times |
Fri 21 November 2025 |
11.15 (-0.54%) |
11.21 |
11.14 - 11.21 |
0.6876 times |
Thu 20 November 2025 |
11.21 (0.36%) |
11.15 |
11.15 - 11.24 |
1.0109 times |
Wed 19 November 2025 |
11.17 (-0.62%) |
11.18 |
11.17 - 11.30 |
0.7258 times |
Weekly price and charts BlackrockMuniyield Strong weekly Stock price targets for BlackrockMuniyield MPA are 11.21 and 11.37 | Weekly Target 1 | 11.08 | | Weekly Target 2 | 11.18 | | Weekly Target 3 | 11.243333333333 | | Weekly Target 4 | 11.34 | | Weekly Target 5 | 11.4 |
Weekly price and volumes for Blackrock Muniyield
| Date |
Closing |
Open |
Range |
Volume |
Thu 04 December 2025 |
11.27 (-0.27%) |
11.21 |
11.15 - 11.31 |
1.66 times |
Fri 28 November 2025 |
11.30 (1.35%) |
11.20 |
11.13 - 11.30 |
0.7168 times |
Fri 21 November 2025 |
11.15 (-1.41%) |
11.34 |
11.09 - 11.34 |
1.6305 times |
Fri 14 November 2025 |
11.31 (-0.09%) |
11.40 |
11.27 - 11.47 |
0.9474 times |
Fri 07 November 2025 |
11.32 (-1.22%) |
11.39 |
11.29 - 11.46 |
0.9129 times |
Fri 31 October 2025 |
11.46 (0%) |
11.46 |
11.40 - 11.46 |
0.1329 times |
Fri 31 October 2025 |
11.46 (0.44%) |
11.41 |
11.29 - 11.50 |
1.3394 times |
Fri 24 October 2025 |
11.41 (0.62%) |
11.37 |
11.31 - 11.54 |
1.0399 times |
Fri 17 October 2025 |
11.34 (0.18%) |
11.34 |
11.33 - 11.51 |
1.0685 times |
Tue 07 October 2025 |
11.32 (-0.26%) |
11.34 |
11.23 - 11.40 |
0.5516 times |
Fri 03 October 2025 |
11.35 (1.07%) |
11.29 |
11.23 - 11.49 |
2.2994 times |
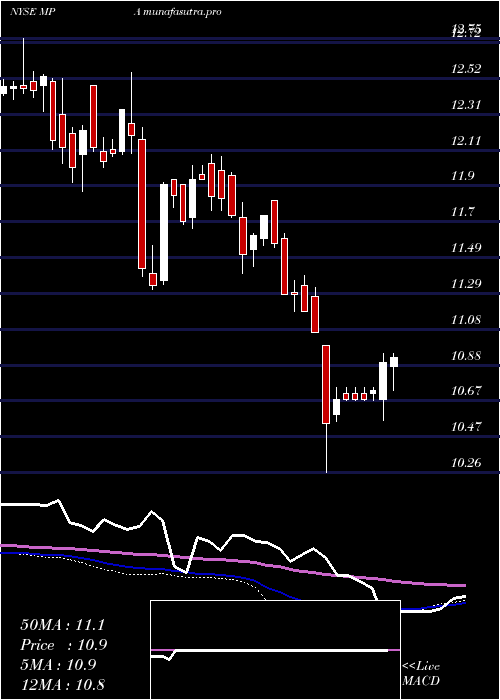
Monthly price and charts BlackrockMuniyield Strong monthly Stock price targets for BlackrockMuniyield MPA are 11.21 and 11.37 | Monthly Target 1 | 11.08 | | Monthly Target 2 | 11.18 | | Monthly Target 3 | 11.243333333333 | | Monthly Target 4 | 11.34 | | Monthly Target 5 | 11.4 |
Monthly price and volumes Blackrock Muniyield
| Date |
Closing |
Open |
Range |
Volume |
Thu 04 December 2025 |
11.27 (-0.27%) |
11.21 |
11.15 - 11.31 |
0.2344 times |
Fri 28 November 2025 |
11.30 (-1.4%) |
11.39 |
11.09 - 11.47 |
0.5942 times |
Fri 31 October 2025 |
11.46 (0.79%) |
11.38 |
11.23 - 11.54 |
0.8419 times |
Tue 30 September 2025 |
11.37 (5.08%) |
10.82 |
10.79 - 11.48 |
0.7707 times |
Fri 29 August 2025 |
10.82 (1.5%) |
10.70 |
10.63 - 10.92 |
0.6713 times |
Thu 31 July 2025 |
10.66 (-1.2%) |
10.87 |
10.50 - 10.87 |
2.3674 times |
Mon 30 June 2025 |
10.79 (-0.37%) |
10.81 |
10.66 - 10.92 |
1.1969 times |
Fri 30 May 2025 |
10.83 (-1.37%) |
11.10 |
10.70 - 11.23 |
1.2856 times |
Wed 30 April 2025 |
10.98 (-2.05%) |
11.31 |
10.26 - 11.32 |
1.5361 times |
Mon 31 March 2025 |
11.21 (-4.43%) |
11.82 |
11.18 - 11.82 |
0.5016 times |
Fri 28 February 2025 |
11.73 (-0.85%) |
11.96 |
11.40 - 11.98 |
0.8627 times |

DMA SMA EMA moving averages of Blackrock Muniyield MPA
DMA (daily moving average) of Blackrock Muniyield MPA
| DMA period | DMA value | | 5 day DMA | 11.26 | | 12 day DMA | 11.23 | | 20 day DMA | 11.29 | | 35 day DMA | 11.33 | | 50 day DMA | 11.35 | | 100 day DMA | 11.09 | | 150 day DMA | 11.01 | | 200 day DMA | 11.05 | EMA (exponential moving average) of Blackrock Muniyield MPA
| EMA period | EMA current | EMA prev | EMA prev2 | | 5 day EMA | 11.26 | 11.26 | 11.23 | | 12 day EMA | 11.26 | 11.26 | 11.25 | | 20 day EMA | 11.27 | 11.27 | 11.27 | | 35 day EMA | 11.3 | 11.3 | 11.3 | | 50 day EMA | 11.34 | 11.34 | 11.34 |
SMA (simple moving average) of Blackrock Muniyield MPA
| SMA period | SMA current | SMA prev | SMA prev2 | | 5 day SMA | 11.26 | 11.26 | 11.25 | | 12 day SMA | 11.23 | 11.24 | 11.24 | | 20 day SMA | 11.29 | 11.29 | 11.29 | | 35 day SMA | 11.33 | 11.34 | 11.34 | | 50 day SMA | 11.35 | 11.35 | 11.35 | | 100 day SMA | 11.09 | 11.09 | 11.08 | | 150 day SMA | 11.01 | 11.01 | 11 | | 200 day SMA | 11.05 | 11.05 | 11.05 |
|
|
