MolinaHealthcare MOH full analysis,charts,indicators,moving averages,SMA,DMA,EMA,ADX,MACD,RSIMolina Healthcare MOH WideScreen charts, DMA,SMA,EMA technical analysis, forecast prediction, by indicators ADX,MACD,RSI,CCI NYSE stock exchange
operates under Health Care sector & deals in Medical Specialities
Daily price and charts and targets MolinaHealthcare Strong Daily Stock price targets for MolinaHealthcare MOH are 192.02 and 204.01 | Daily Target 1 | 182.43 | | Daily Target 2 | 189.61 | | Daily Target 3 | 194.41666666667 | | Daily Target 4 | 201.6 | | Daily Target 5 | 206.41 |
Daily price and volume Molina Healthcare
| Date |
Closing |
Open |
Range |
Volume |
Tue 21 October 2025 |
196.80 (-0.35%) |
193.87 |
187.23 - 199.22 |
1.5317 times |
Mon 20 October 2025 |
197.49 (2.5%) |
193.10 |
192.76 - 198.84 |
1.042 times |
Fri 17 October 2025 |
192.68 (2.18%) |
188.71 |
187.43 - 192.76 |
0.8678 times |
Thu 16 October 2025 |
188.56 (-1.99%) |
188.33 |
186.00 - 192.18 |
1.1027 times |
Wed 15 October 2025 |
192.39 (-1.28%) |
192.27 |
188.40 - 193.33 |
0.9617 times |
Tue 14 October 2025 |
194.89 (0.32%) |
192.32 |
191.70 - 196.24 |
0.7973 times |
Mon 13 October 2025 |
194.27 (0.11%) |
193.66 |
192.19 - 196.54 |
0.7429 times |
Fri 10 October 2025 |
194.05 (-3.15%) |
201.89 |
193.27 - 201.89 |
0.8303 times |
Thu 09 October 2025 |
200.36 (-1.43%) |
204.80 |
200.16 - 204.80 |
0.9845 times |
Tue 07 October 2025 |
203.26 (1.34%) |
203.86 |
202.40 - 206.89 |
1.1392 times |
Mon 06 October 2025 |
200.57 (-0.69%) |
202.70 |
199.77 - 204.50 |
0.4709 times |
Weekly price and charts MolinaHealthcare Strong weekly Stock price targets for MolinaHealthcare MOH are 192.02 and 204.01 | Weekly Target 1 | 182.43 | | Weekly Target 2 | 189.61 | | Weekly Target 3 | 194.41666666667 | | Weekly Target 4 | 201.6 | | Weekly Target 5 | 206.41 |
Weekly price and volumes for Molina Healthcare
| Date |
Closing |
Open |
Range |
Volume |
Tue 21 October 2025 |
196.80 (2.14%) |
193.10 |
187.23 - 199.22 |
0.5451 times |
Fri 17 October 2025 |
192.68 (-0.71%) |
193.66 |
186.00 - 196.54 |
0.9473 times |
Fri 10 October 2025 |
194.05 (-3.92%) |
202.70 |
193.27 - 206.89 |
0.7254 times |
Fri 03 October 2025 |
201.97 (5.2%) |
192.00 |
189.45 - 203.27 |
0.761 times |
Fri 26 September 2025 |
191.98 (9.62%) |
174.79 |
174.00 - 195.16 |
1.3215 times |
Fri 19 September 2025 |
175.14 (-3.17%) |
181.09 |
174.37 - 181.66 |
1.1724 times |
Fri 12 September 2025 |
180.88 (3.57%) |
175.47 |
171.57 - 197.79 |
1.2987 times |
Fri 05 September 2025 |
174.65 (-3.42%) |
181.31 |
166.46 - 184.83 |
1.3276 times |
Fri 29 August 2025 |
180.83 (0%) |
174.88 |
174.88 - 181.11 |
0.3125 times |
Fri 29 August 2025 |
180.83 (3.66%) |
175.00 |
172.22 - 181.11 |
1.5884 times |
Fri 22 August 2025 |
174.44 (4.15%) |
171.73 |
168.96 - 177.98 |
1.7175 times |

Monthly price and charts MolinaHealthcare Strong monthly Stock price targets for MolinaHealthcare MOH are 191.4 and 212.29 | Monthly Target 1 | 175.67 | | Monthly Target 2 | 186.24 | | Monthly Target 3 | 196.56333333333 | | Monthly Target 4 | 207.13 | | Monthly Target 5 | 217.45 |
Monthly price and volumes Molina Healthcare
| Date |
Closing |
Open |
Range |
Volume |
Tue 21 October 2025 |
196.80 (2.84%) |
192.38 |
186.00 - 206.89 |
0.6226 times |
Tue 30 September 2025 |
191.36 (5.82%) |
181.31 |
166.46 - 197.79 |
1.2725 times |
Fri 29 August 2025 |
180.83 (14.54%) |
159.31 |
151.95 - 181.11 |
1.5584 times |
Thu 31 July 2025 |
157.87 (-47.01%) |
296.54 |
155.53 - 311.52 |
2.3191 times |
Mon 30 June 2025 |
297.90 (-2.34%) |
301.98 |
287.02 - 303.98 |
0.5378 times |
Fri 30 May 2025 |
305.04 (-6.72%) |
324.56 |
291.20 - 333.00 |
0.6092 times |
Wed 30 April 2025 |
327.01 (-0.72%) |
331.01 |
299.65 - 359.97 |
0.913 times |
Mon 31 March 2025 |
329.39 (9.39%) |
302.81 |
299.88 - 338.33 |
0.665 times |
Fri 28 February 2025 |
301.12 (-2.99%) |
308.72 |
262.32 - 327.41 |
0.9198 times |
Fri 31 January 2025 |
310.41 (6.65%) |
295.01 |
273.89 - 317.37 |
0.5825 times |
Tue 31 December 2024 |
291.05 (-1.95%) |
308.95 |
286.85 - 309.16 |
0.469 times |

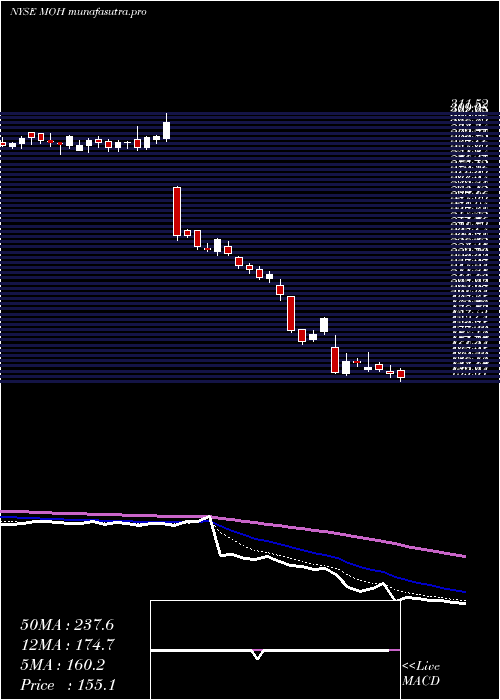
DMA SMA EMA moving averages of Molina Healthcare MOH
DMA (daily moving average) of Molina Healthcare MOH
| DMA period | DMA value | | 5 day DMA | 193.58 | | 12 day DMA | 196.44 | | 20 day DMA | 194.16 | | 35 day DMA | 187.43 | | 50 day DMA | 182.64 | | 100 day DMA | 210.58 | | 150 day DMA | 248.46 | | 200 day DMA | 261.09 | EMA (exponential moving average) of Molina Healthcare MOH
| EMA period | EMA current | EMA prev | EMA prev2 | | 5 day EMA | 195.13 | 194.3 | 192.71 | | 12 day EMA | 194.35 | 193.91 | 193.26 | | 20 day EMA | 192.29 | 191.82 | 191.22 | | 35 day EMA | 187.43 | 186.88 | 186.26 | | 50 day EMA | 181.46 | 180.83 | 180.15 |
SMA (simple moving average) of Molina Healthcare MOH
| SMA period | SMA current | SMA prev | SMA prev2 | | 5 day SMA | 193.58 | 193.2 | 192.56 | | 12 day SMA | 196.44 | 196.23 | 195.84 | | 20 day SMA | 194.16 | 193.41 | 192.3 | | 35 day SMA | 187.43 | 186.98 | 186.5 | | 50 day SMA | 182.64 | 181.78 | 180.97 | | 100 day SMA | 210.58 | 211.69 | 212.76 | | 150 day SMA | 248.46 | 249.26 | 250 | | 200 day SMA | 261.09 | 261.57 | 262.02 |
|
|
