WesternAsset MMU full analysis,charts,indicators,moving averages,SMA,DMA,EMA,ADX,MACD,RSIWestern Asset MMU WideScreen charts, DMA,SMA,EMA technical analysis, forecast prediction, by indicators ADX,MACD,RSI,CCI NYSE stock exchange
operates under N A sector & deals in N A
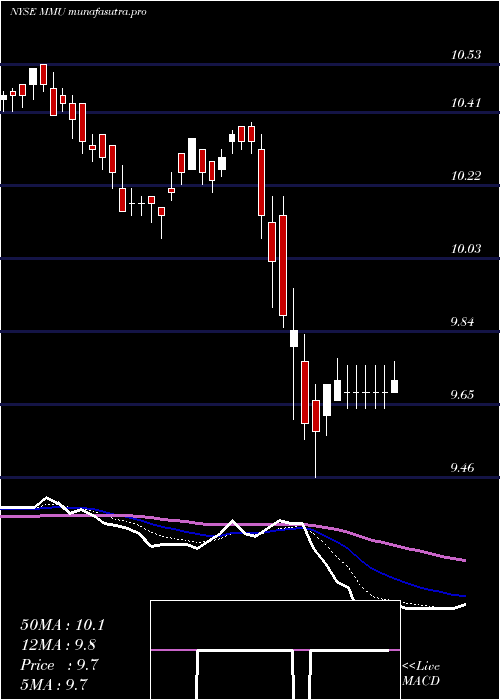
Daily price and charts and targets WesternAsset Strong Daily Stock price targets for WesternAsset MMU are 10.46 and 10.5 | Daily Target 1 | 10.43 | | Daily Target 2 | 10.45 | | Daily Target 3 | 10.466666666667 | | Daily Target 4 | 10.49 | | Daily Target 5 | 10.51 |
Daily price and volume Western Asset
| Date |
Closing |
Open |
Range |
Volume |
Thu 04 December 2025 |
10.48 (0.29%) |
10.48 |
10.44 - 10.48 |
1.029 times |
Wed 03 December 2025 |
10.45 (0.77%) |
10.39 |
10.31 - 10.47 |
2.3017 times |
Tue 02 December 2025 |
10.37 (0.58%) |
10.34 |
10.29 - 10.38 |
0.9506 times |
Mon 01 December 2025 |
10.31 (-0.39%) |
10.34 |
10.30 - 10.36 |
0.5807 times |
Fri 28 November 2025 |
10.35 (0.1%) |
10.30 |
10.28 - 10.40 |
0.5106 times |
Wed 26 November 2025 |
10.34 (0.29%) |
10.28 |
10.24 - 10.34 |
1.0859 times |
Tue 25 November 2025 |
10.31 (0.78%) |
10.28 |
10.24 - 10.50 |
1.0296 times |
Mon 24 November 2025 |
10.23 (-0.2%) |
10.23 |
10.22 - 10.26 |
0.9764 times |
Fri 21 November 2025 |
10.25 (-0.19%) |
10.31 |
10.22 - 10.31 |
0.7824 times |
Thu 20 November 2025 |
10.27 (-0.96%) |
10.30 |
10.23 - 10.34 |
0.7531 times |
Wed 19 November 2025 |
10.37 (-0.29%) |
10.42 |
10.35 - 10.42 |
1.0374 times |
Weekly price and charts WesternAsset Strong weekly Stock price targets for WesternAsset MMU are 10.39 and 10.58 | Weekly Target 1 | 10.23 | | Weekly Target 2 | 10.35 | | Weekly Target 3 | 10.416666666667 | | Weekly Target 4 | 10.54 | | Weekly Target 5 | 10.61 |
Weekly price and volumes for Western Asset
| Date |
Closing |
Open |
Range |
Volume |
Thu 04 December 2025 |
10.48 (1.26%) |
10.34 |
10.29 - 10.48 |
1.3947 times |
Fri 28 November 2025 |
10.35 (0.98%) |
10.23 |
10.22 - 10.50 |
1.0334 times |
Fri 21 November 2025 |
10.25 (-1.63%) |
10.42 |
10.22 - 10.42 |
1.1112 times |
Fri 14 November 2025 |
10.42 (1.26%) |
10.33 |
10.30 - 10.45 |
1.0609 times |
Fri 07 November 2025 |
10.29 (-0.19%) |
10.31 |
10.25 - 10.42 |
1.265 times |
Fri 31 October 2025 |
10.31 (0%) |
10.33 |
10.29 - 10.35 |
0.3302 times |
Fri 31 October 2025 |
10.31 (-1.15%) |
10.43 |
10.26 - 10.43 |
1.3136 times |
Fri 24 October 2025 |
10.43 (0.58%) |
10.39 |
10.37 - 10.46 |
0.8715 times |
Fri 17 October 2025 |
10.37 (0.29%) |
10.35 |
10.31 - 10.42 |
1.099 times |
Tue 07 October 2025 |
10.34 (0%) |
10.34 |
10.29 - 10.35 |
0.5207 times |
Fri 03 October 2025 |
10.34 (0.19%) |
10.35 |
10.29 - 10.65 |
1.1912 times |
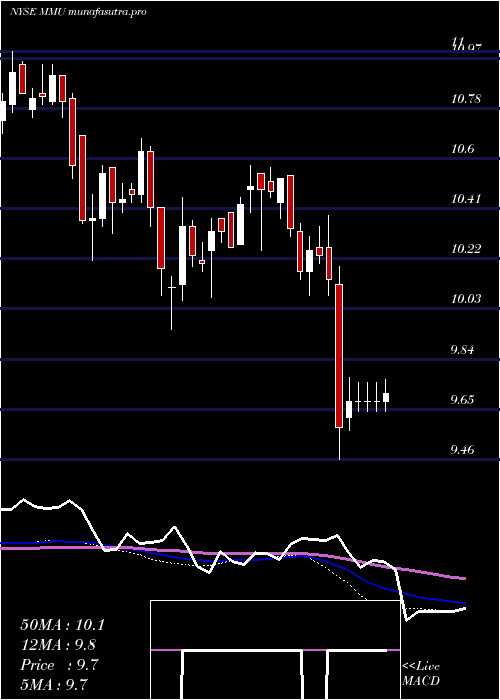
Monthly price and charts WesternAsset Strong monthly Stock price targets for WesternAsset MMU are 10.39 and 10.58 | Monthly Target 1 | 10.23 | | Monthly Target 2 | 10.35 | | Monthly Target 3 | 10.416666666667 | | Monthly Target 4 | 10.54 | | Monthly Target 5 | 10.61 |
Monthly price and volumes Western Asset
| Date |
Closing |
Open |
Range |
Volume |
Thu 04 December 2025 |
10.48 (1.26%) |
10.34 |
10.29 - 10.48 |
0.3173 times |
Fri 28 November 2025 |
10.35 (0.39%) |
10.31 |
10.22 - 10.50 |
1.017 times |
Fri 31 October 2025 |
10.31 (-0.29%) |
10.40 |
10.26 - 10.65 |
1.1192 times |
Tue 30 September 2025 |
10.34 (4.55%) |
9.89 |
9.85 - 10.44 |
1.2989 times |
Fri 29 August 2025 |
9.89 (-0.4%) |
9.95 |
9.79 - 10.00 |
1.4268 times |
Thu 31 July 2025 |
9.93 (0.3%) |
9.96 |
9.79 - 10.10 |
0.9721 times |
Mon 30 June 2025 |
9.90 (-0.1%) |
9.91 |
9.75 - 9.99 |
0.8189 times |
Fri 30 May 2025 |
9.91 (-0.6%) |
10.03 |
9.76 - 10.72 |
0.9469 times |
Wed 30 April 2025 |
9.97 (-3.11%) |
10.33 |
9.46 - 10.38 |
1.3021 times |
Mon 31 March 2025 |
10.29 (-2.19%) |
10.53 |
10.08 - 10.53 |
0.7808 times |
Fri 28 February 2025 |
10.52 (0.96%) |
10.48 |
10.25 - 10.57 |
1.0443 times |

DMA SMA EMA moving averages of Western Asset MMU
DMA (daily moving average) of Western Asset MMU
| DMA period | DMA value | | 5 day DMA | 10.39 | | 12 day DMA | 10.34 | | 20 day DMA | 10.35 | | 35 day DMA | 10.36 | | 50 day DMA | 10.36 | | 100 day DMA | 10.18 | | 150 day DMA | 10.1 | | 200 day DMA | 10.11 | EMA (exponential moving average) of Western Asset MMU
| EMA period | EMA current | EMA prev | EMA prev2 | | 5 day EMA | 10.41 | 10.38 | 10.34 | | 12 day EMA | 10.37 | 10.35 | 10.33 | | 20 day EMA | 10.36 | 10.35 | 10.34 | | 35 day EMA | 10.36 | 10.35 | 10.34 | | 50 day EMA | 10.36 | 10.36 | 10.36 |
SMA (simple moving average) of Western Asset MMU
| SMA period | SMA current | SMA prev | SMA prev2 | | 5 day SMA | 10.39 | 10.36 | 10.34 | | 12 day SMA | 10.34 | 10.34 | 10.34 | | 20 day SMA | 10.35 | 10.34 | 10.34 | | 35 day SMA | 10.36 | 10.36 | 10.36 | | 50 day SMA | 10.36 | 10.36 | 10.36 | | 100 day SMA | 10.18 | 10.17 | 10.17 | | 150 day SMA | 10.1 | 10.1 | 10.09 | | 200 day SMA | 10.11 | 10.11 | 10.11 |
|
|
