MaximusInc MMS full analysis,charts,indicators,moving averages,SMA,DMA,EMA,ADX,MACD,RSIMaximus Inc MMS WideScreen charts, DMA,SMA,EMA technical analysis, forecast prediction, by indicators ADX,MACD,RSI,CCI NYSE stock exchange
operates under Miscellaneous sector & deals in Business Services
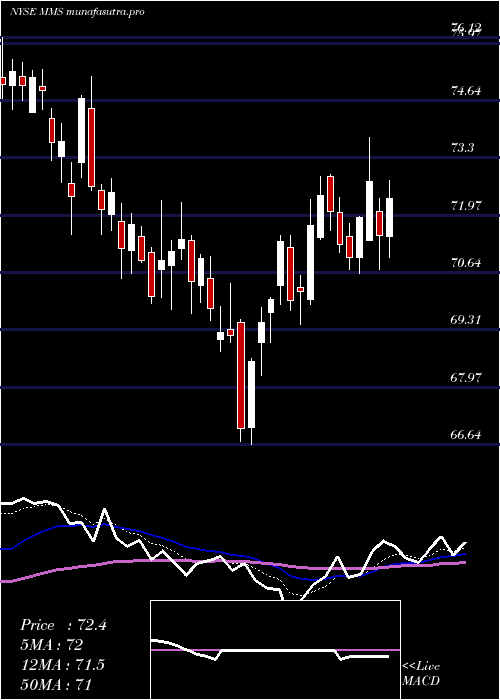
Daily price and charts and targets MaximusInc Strong Daily Stock price targets for MaximusInc MMS are 84.01 and 85.37 | Daily Target 1 | 82.88 | | Daily Target 2 | 83.78 | | Daily Target 3 | 84.243333333333 | | Daily Target 4 | 85.14 | | Daily Target 5 | 85.6 |
Daily price and volume Maximus Inc
| Date |
Closing |
Open |
Range |
Volume |
Fri 05 December 2025 |
84.67 (0.12%) |
84.35 |
83.35 - 84.71 |
1.2585 times |
Thu 04 December 2025 |
84.57 (-0.34%) |
84.65 |
84.24 - 86.80 |
0.6924 times |
Wed 03 December 2025 |
84.86 (-1.94%) |
86.84 |
84.74 - 87.25 |
0.9094 times |
Tue 02 December 2025 |
86.54 (-0.59%) |
87.84 |
85.83 - 87.92 |
0.3711 times |
Mon 01 December 2025 |
87.05 (1.12%) |
85.92 |
85.57 - 87.31 |
1.0254 times |
Fri 28 November 2025 |
86.09 (-0.15%) |
86.43 |
85.53 - 86.64 |
0.4045 times |
Wed 26 November 2025 |
86.22 (-0.48%) |
86.27 |
86.22 - 88.00 |
0.773 times |
Tue 25 November 2025 |
86.64 (-1.24%) |
88.03 |
86.50 - 88.92 |
1.0831 times |
Mon 24 November 2025 |
87.73 (3.37%) |
84.79 |
84.47 - 87.82 |
1.4343 times |
Fri 21 November 2025 |
84.87 (3.42%) |
83.00 |
81.60 - 86.56 |
2.0482 times |
Thu 20 November 2025 |
82.06 (5.53%) |
79.21 |
79.21 - 84.27 |
2.4684 times |
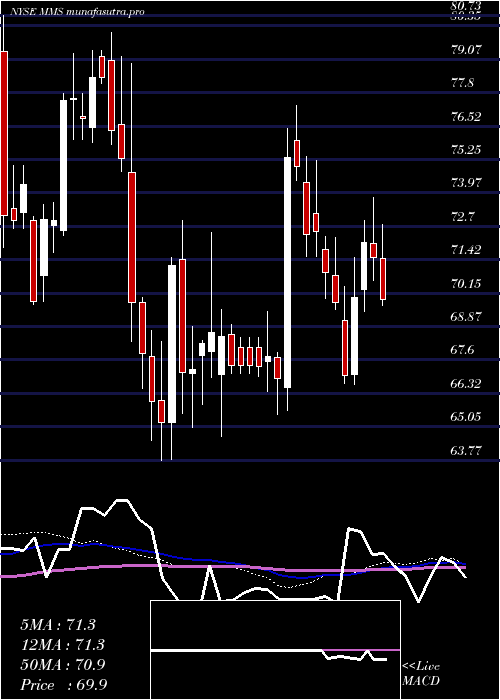
Weekly price and charts MaximusInc Strong weekly Stock price targets for MaximusInc MMS are 81.73 and 86.3 | Weekly Target 1 | 80.74 | | Weekly Target 2 | 82.71 | | Weekly Target 3 | 85.313333333333 | | Weekly Target 4 | 87.28 | | Weekly Target 5 | 89.88 |
Weekly price and volumes for Maximus Inc
| Date |
Closing |
Open |
Range |
Volume |
Fri 05 December 2025 |
84.67 (-1.65%) |
85.92 |
83.35 - 87.92 |
1.2262 times |
Fri 28 November 2025 |
86.09 (1.44%) |
84.79 |
84.47 - 88.92 |
1.0644 times |
Fri 21 November 2025 |
84.87 (6.35%) |
79.81 |
77.59 - 86.56 |
2.2017 times |
Fri 14 November 2025 |
79.80 (-5.09%) |
84.16 |
79.16 - 84.36 |
1.0782 times |
Fri 07 November 2025 |
84.08 (1.15%) |
83.40 |
82.09 - 84.81 |
0.7689 times |
Fri 31 October 2025 |
83.12 (0%) |
82.88 |
80.59 - 83.38 |
0.3042 times |
Fri 31 October 2025 |
83.12 (-5.24%) |
87.54 |
80.59 - 88.09 |
0.9744 times |
Fri 24 October 2025 |
87.72 (2.98%) |
85.58 |
85.18 - 88.96 |
0.9298 times |
Fri 17 October 2025 |
85.18 (-5.6%) |
85.58 |
83.03 - 86.30 |
1.1142 times |
Tue 07 October 2025 |
90.23 (-1.11%) |
91.80 |
89.24 - 92.50 |
0.3381 times |
Fri 03 October 2025 |
91.24 (3.54%) |
88.20 |
87.77 - 92.28 |
1.101 times |
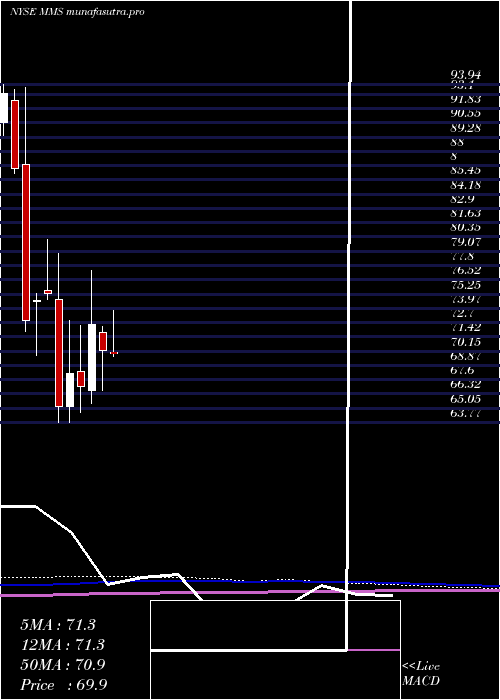
Monthly price and charts MaximusInc Strong monthly Stock price targets for MaximusInc MMS are 81.73 and 86.3 | Monthly Target 1 | 80.74 | | Monthly Target 2 | 82.71 | | Monthly Target 3 | 85.313333333333 | | Monthly Target 4 | 87.28 | | Monthly Target 5 | 89.88 |
Monthly price and volumes Maximus Inc
| Date |
Closing |
Open |
Range |
Volume |
Fri 05 December 2025 |
84.67 (-1.65%) |
85.92 |
83.35 - 87.92 |
0.2748 times |
Fri 28 November 2025 |
86.09 (3.57%) |
83.40 |
77.59 - 88.92 |
1.146 times |
Fri 31 October 2025 |
83.12 (-9.03%) |
90.86 |
80.59 - 92.50 |
0.9618 times |
Tue 30 September 2025 |
91.37 (3.92%) |
87.24 |
86.59 - 91.73 |
1.2784 times |
Fri 29 August 2025 |
87.92 (19.04%) |
73.74 |
72.34 - 88.91 |
1.3798 times |
Thu 31 July 2025 |
73.86 (5.21%) |
70.01 |
69.59 - 75.28 |
0.9307 times |
Mon 30 June 2025 |
70.20 (-3.19%) |
71.82 |
66.64 - 72.31 |
0.7858 times |
Fri 30 May 2025 |
72.51 (8.29%) |
66.62 |
65.50 - 77.31 |
0.9592 times |
Wed 30 April 2025 |
66.96 (-1.8%) |
68.34 |
64.68 - 72.47 |
0.9553 times |
Mon 31 March 2025 |
68.19 (4.59%) |
65.21 |
63.80 - 72.92 |
1.3281 times |
Fri 28 February 2025 |
65.20 (-13.4%) |
74.74 |
63.77 - 78.90 |
1.4914 times |
DMA SMA EMA moving averages of Maximus Inc MMS
DMA (daily moving average) of Maximus Inc MMS
| DMA period | DMA value | | 5 day DMA | 85.54 | | 12 day DMA | 84.92 | | 20 day DMA | 83.35 | | 35 day DMA | 84.23 | | 50 day DMA | 85.45 | | 100 day DMA | 83.65 | | 150 day DMA | 79.54 | | 200 day DMA | 76.58 | EMA (exponential moving average) of Maximus Inc MMS
| EMA period | EMA current | EMA prev | EMA prev2 | | 5 day EMA | 85.13 | 85.36 | 85.75 | | 12 day EMA | 84.76 | 84.78 | 84.82 | | 20 day EMA | 84.47 | 84.45 | 84.44 | | 35 day EMA | 84.93 | 84.95 | 84.97 | | 50 day EMA | 85.71 | 85.75 | 85.8 |
SMA (simple moving average) of Maximus Inc MMS
| SMA period | SMA current | SMA prev | SMA prev2 | | 5 day SMA | 85.54 | 85.82 | 86.15 | | 12 day SMA | 84.92 | 84.45 | 83.93 | | 20 day SMA | 83.35 | 83.26 | 83.24 | | 35 day SMA | 84.23 | 84.21 | 84.19 | | 50 day SMA | 85.45 | 85.53 | 85.62 | | 100 day SMA | 83.65 | 83.52 | 83.4 | | 150 day SMA | 79.54 | 79.42 | 79.31 | | 200 day SMA | 76.58 | 76.49 | 76.41 |
|
|
