MillerIndustries MLR full analysis,charts,indicators,moving averages,SMA,DMA,EMA,ADX,MACD,RSIMiller Industries MLR WideScreen charts, DMA,SMA,EMA technical analysis, forecast prediction, by indicators ADX,MACD,RSI,CCI NYSE stock exchange
operates under Capital Goods sector & deals in Construction Ag Equipment Trucks
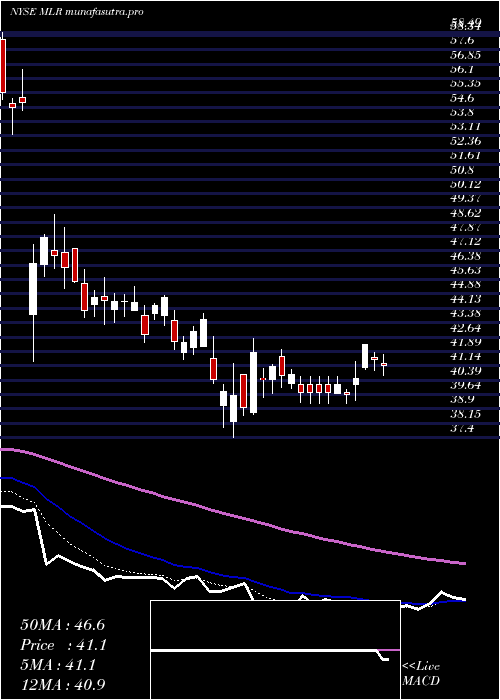
Daily price and charts and targets MillerIndustries Strong Daily Stock price targets for MillerIndustries MLR are 40.71 and 41.39 | Daily Target 1 | 40.17 | | Daily Target 2 | 40.56 | | Daily Target 3 | 40.85 | | Daily Target 4 | 41.24 | | Daily Target 5 | 41.53 |
Daily price and volume Miller Industries
| Date |
Closing |
Open |
Range |
Volume |
Mon 20 October 2025 |
40.95 (1.97%) |
40.46 |
40.46 - 41.14 |
0.6285 times |
Fri 17 October 2025 |
40.16 (-1.23%) |
40.40 |
40.00 - 41.03 |
0.811 times |
Thu 16 October 2025 |
40.66 (-2.17%) |
41.58 |
40.66 - 41.76 |
0.9876 times |
Wed 15 October 2025 |
41.56 (1.29%) |
41.16 |
41.06 - 41.67 |
0.6344 times |
Tue 14 October 2025 |
41.03 (1.03%) |
40.24 |
40.24 - 41.55 |
0.9479 times |
Mon 13 October 2025 |
40.61 (1.8%) |
39.93 |
39.75 - 40.65 |
1.4924 times |
Tue 07 October 2025 |
39.89 (-0.25%) |
39.78 |
39.39 - 40.24 |
1.8148 times |
Mon 06 October 2025 |
39.99 (-1.26%) |
40.52 |
39.77 - 40.81 |
1.5669 times |
Fri 03 October 2025 |
40.50 (0.6%) |
40.39 |
40.19 - 41.07 |
0.7227 times |
Thu 02 October 2025 |
40.26 (0.57%) |
40.04 |
39.89 - 40.82 |
0.3939 times |
Wed 01 October 2025 |
40.03 (-0.96%) |
40.19 |
39.88 - 40.68 |
1.3085 times |
Weekly price and charts MillerIndustries Strong weekly Stock price targets for MillerIndustries MLR are 40.71 and 41.39 | Weekly Target 1 | 40.17 | | Weekly Target 2 | 40.56 | | Weekly Target 3 | 40.85 | | Weekly Target 4 | 41.24 | | Weekly Target 5 | 41.53 |
Weekly price and volumes for Miller Industries
| Date |
Closing |
Open |
Range |
Volume |
Mon 20 October 2025 |
40.95 (1.97%) |
40.46 |
40.46 - 41.14 |
0.1158 times |
Fri 17 October 2025 |
40.16 (0.68%) |
39.93 |
39.75 - 41.76 |
0.8976 times |
Tue 07 October 2025 |
39.89 (-1.51%) |
40.52 |
39.39 - 40.81 |
0.6229 times |
Fri 03 October 2025 |
40.50 (2.61%) |
39.66 |
39.01 - 41.07 |
0.9542 times |
Fri 26 September 2025 |
39.47 (3.35%) |
38.08 |
38.08 - 40.11 |
1.5493 times |
Fri 19 September 2025 |
38.19 (-3.92%) |
40.02 |
38.00 - 41.11 |
1.9549 times |
Fri 12 September 2025 |
39.75 (-4.86%) |
41.69 |
39.45 - 41.90 |
1.0904 times |
Fri 05 September 2025 |
41.78 (-0.74%) |
41.63 |
40.03 - 42.50 |
1.0093 times |
Fri 29 August 2025 |
42.09 (0%) |
42.36 |
41.64 - 42.96 |
0.2445 times |
Fri 29 August 2025 |
42.09 (-6.17%) |
44.64 |
41.64 - 45.09 |
1.5612 times |
Fri 22 August 2025 |
44.86 (4.33%) |
42.93 |
42.63 - 45.30 |
1.7453 times |
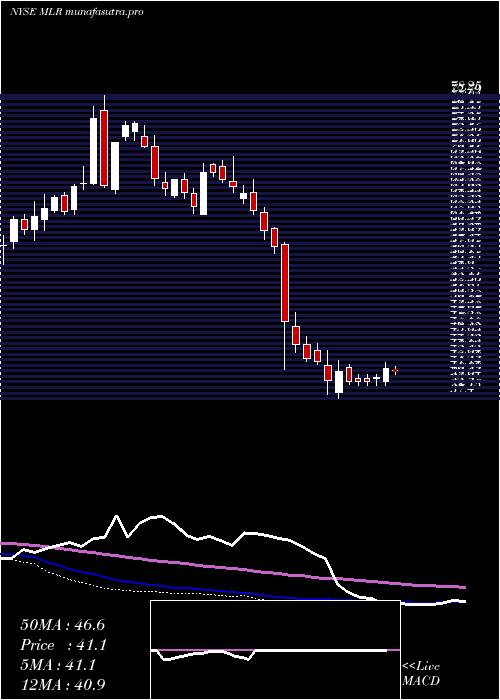
Monthly price and charts MillerIndustries Strong monthly Stock price targets for MillerIndustries MLR are 40.17 and 42.54 | Monthly Target 1 | 38.33 | | Monthly Target 2 | 39.64 | | Monthly Target 3 | 40.7 | | Monthly Target 4 | 42.01 | | Monthly Target 5 | 43.07 |
Monthly price and volumes Miller Industries
| Date |
Closing |
Open |
Range |
Volume |
Mon 20 October 2025 |
40.95 (1.31%) |
40.19 |
39.39 - 41.76 |
0.3881 times |
Tue 30 September 2025 |
40.42 (-3.97%) |
41.63 |
38.00 - 42.50 |
1.1386 times |
Fri 29 August 2025 |
42.09 (3.29%) |
40.25 |
33.81 - 45.30 |
1.618 times |
Thu 31 July 2025 |
40.75 (-8.34%) |
44.18 |
40.29 - 47.41 |
0.8768 times |
Mon 30 June 2025 |
44.46 (-1.92%) |
45.40 |
42.91 - 46.56 |
0.6669 times |
Fri 30 May 2025 |
45.33 (11.08%) |
40.98 |
40.45 - 47.73 |
0.6524 times |
Wed 30 April 2025 |
40.81 (-3.68%) |
42.11 |
37.40 - 43.85 |
0.9799 times |
Mon 31 March 2025 |
42.37 (-26.85%) |
58.14 |
41.38 - 58.49 |
1.9358 times |
Fri 28 February 2025 |
57.92 (-12.2%) |
64.40 |
56.93 - 66.93 |
0.8292 times |
Fri 31 January 2025 |
65.97 (0.93%) |
66.36 |
62.25 - 70.06 |
0.9143 times |
Tue 31 December 2024 |
65.36 (-12%) |
74.01 |
64.55 - 74.50 |
0.6209 times |

DMA SMA EMA moving averages of Miller Industries MLR
DMA (daily moving average) of Miller Industries MLR
| DMA period | DMA value | | 5 day DMA | 40.87 | | 12 day DMA | 40.51 | | 20 day DMA | 40.03 | | 35 day DMA | 40.35 | | 50 day DMA | 41.1 | | 100 day DMA | 42.64 | | 150 day DMA | 42.67 | | 200 day DMA | 47.68 | EMA (exponential moving average) of Miller Industries MLR
| EMA period | EMA current | EMA prev | EMA prev2 | | 5 day EMA | 40.7 | 40.58 | 40.79 | | 12 day EMA | 40.49 | 40.41 | 40.45 | | 20 day EMA | 40.4 | 40.34 | 40.36 | | 35 day EMA | 40.7 | 40.69 | 40.72 | | 50 day EMA | 41.07 | 41.07 | 41.11 |
SMA (simple moving average) of Miller Industries MLR
| SMA period | SMA current | SMA prev | SMA prev2 | | 5 day SMA | 40.87 | 40.8 | 40.75 | | 12 day SMA | 40.51 | 40.4 | 40.34 | | 20 day SMA | 40.03 | 39.95 | 39.92 | | 35 day SMA | 40.35 | 40.44 | 40.56 | | 50 day SMA | 41.1 | 41.11 | 41.13 | | 100 day SMA | 42.64 | 42.68 | 42.74 | | 150 day SMA | 42.67 | 42.7 | 42.75 | | 200 day SMA | 47.68 | 47.8 | 47.94 |
|
|
