MauiLand MLP full analysis,charts,indicators,moving averages,SMA,DMA,EMA,ADX,MACD,RSIMaui Land MLP WideScreen charts, DMA,SMA,EMA technical analysis, forecast prediction, by indicators ADX,MACD,RSI,CCI NYSE stock exchange
operates under Finance sector & deals in Real Estate
Daily price and charts and targets MauiLand Strong Daily Stock price targets for MauiLand MLP are 15.4 and 16.53 | Daily Target 1 | 15.18 | | Daily Target 2 | 15.61 | | Daily Target 3 | 16.31 | | Daily Target 4 | 16.74 | | Daily Target 5 | 17.44 |
Daily price and volume Maui Land
| Date |
Closing |
Open |
Range |
Volume |
Mon 20 October 2025 |
16.04 (-0.56%) |
16.16 |
15.88 - 17.01 |
0.8201 times |
Fri 17 October 2025 |
16.13 (1.83%) |
15.75 |
15.75 - 16.56 |
1.0126 times |
Thu 16 October 2025 |
15.84 (-3.94%) |
16.38 |
15.84 - 16.55 |
0.9692 times |
Wed 15 October 2025 |
16.49 (0.55%) |
16.77 |
16.32 - 17.01 |
0.9257 times |
Tue 14 October 2025 |
16.40 (-2.61%) |
16.63 |
16.38 - 16.96 |
1.2674 times |
Mon 13 October 2025 |
16.84 (-2.66%) |
16.64 |
16.38 - 16.86 |
1.3792 times |
Tue 07 October 2025 |
17.30 (0.46%) |
17.17 |
17.00 - 17.50 |
1.6091 times |
Mon 06 October 2025 |
17.22 (-4.07%) |
17.90 |
17.12 - 17.92 |
0.6529 times |
Fri 03 October 2025 |
17.95 (0.67%) |
17.72 |
17.72 - 18.26 |
0.584 times |
Thu 02 October 2025 |
17.83 (-0.11%) |
17.84 |
17.62 - 18.05 |
0.7799 times |
Wed 01 October 2025 |
17.85 (-4.24%) |
18.42 |
17.82 - 18.70 |
0.8698 times |
Weekly price and charts MauiLand Strong weekly Stock price targets for MauiLand MLP are 15.4 and 16.53 | Weekly Target 1 | 15.18 | | Weekly Target 2 | 15.61 | | Weekly Target 3 | 16.31 | | Weekly Target 4 | 16.74 | | Weekly Target 5 | 17.44 |
Weekly price and volumes for Maui Land
| Date |
Closing |
Open |
Range |
Volume |
Mon 20 October 2025 |
16.04 (-0.56%) |
16.16 |
15.88 - 17.01 |
0.2107 times |
Fri 17 October 2025 |
16.13 (-6.76%) |
16.64 |
15.75 - 17.01 |
1.4271 times |
Tue 07 October 2025 |
17.30 (-3.62%) |
17.90 |
17.00 - 17.92 |
0.5812 times |
Fri 03 October 2025 |
17.95 (-5.68%) |
19.32 |
17.62 - 19.38 |
1.2188 times |
Fri 26 September 2025 |
19.03 (-0.16%) |
19.13 |
18.53 - 20.06 |
1.0519 times |
Fri 19 September 2025 |
19.06 (1.71%) |
18.89 |
18.20 - 20.34 |
1.8293 times |
Fri 12 September 2025 |
18.74 (10.3%) |
16.96 |
16.72 - 19.26 |
1.5707 times |
Fri 05 September 2025 |
16.99 (-2.24%) |
17.19 |
16.79 - 17.55 |
1.3105 times |
Fri 29 August 2025 |
17.38 (0%) |
17.25 |
17.25 - 17.50 |
0.0958 times |
Fri 29 August 2025 |
17.38 (1.58%) |
17.02 |
16.41 - 17.50 |
0.704 times |
Fri 22 August 2025 |
17.11 (-0.06%) |
17.35 |
15.65 - 17.35 |
2.2715 times |

Monthly price and charts MauiLand Strong monthly Stock price targets for MauiLand MLP are 14.42 and 17.37 | Monthly Target 1 | 13.88 | | Monthly Target 2 | 14.96 | | Monthly Target 3 | 16.83 | | Monthly Target 4 | 17.91 | | Monthly Target 5 | 19.78 |
Monthly price and volumes Maui Land
| Date |
Closing |
Open |
Range |
Volume |
Mon 20 October 2025 |
16.04 (-13.95%) |
18.42 |
15.75 - 18.70 |
0.4994 times |
Tue 30 September 2025 |
18.64 (7.25%) |
17.19 |
16.72 - 20.34 |
1.1458 times |
Fri 29 August 2025 |
17.38 (2.18%) |
16.79 |
15.65 - 17.61 |
0.9094 times |
Thu 31 July 2025 |
17.01 (-6.49%) |
18.07 |
15.85 - 18.70 |
0.8971 times |
Mon 30 June 2025 |
18.19 (14.55%) |
15.41 |
15.00 - 19.02 |
1.319 times |
Fri 30 May 2025 |
15.88 (2.25%) |
15.42 |
14.52 - 17.56 |
1.2378 times |
Wed 30 April 2025 |
15.53 (-11.61%) |
17.69 |
14.05 - 17.69 |
1.1446 times |
Mon 31 March 2025 |
17.57 (-9.71%) |
19.63 |
17.02 - 19.91 |
0.853 times |
Fri 28 February 2025 |
19.46 (-3.33%) |
19.80 |
18.61 - 20.87 |
0.6283 times |
Fri 31 January 2025 |
20.13 (-8.42%) |
22.02 |
18.52 - 22.23 |
1.3656 times |
Tue 31 December 2024 |
21.98 (-7.37%) |
23.20 |
21.03 - 23.41 |
1.0108 times |

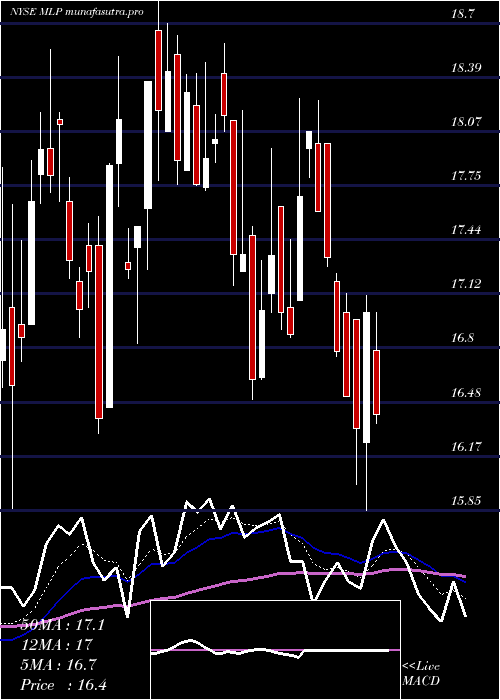
DMA SMA EMA moving averages of Maui Land MLP
DMA (daily moving average) of Maui Land MLP
| DMA period | DMA value | | 5 day DMA | 16.18 | | 12 day DMA | 17.04 | | 20 day DMA | 17.91 | | 35 day DMA | 17.88 | | 50 day DMA | 17.56 | | 100 day DMA | 17.35 | | 150 day DMA | 16.94 | | 200 day DMA | 17.68 | EMA (exponential moving average) of Maui Land MLP
| EMA period | EMA current | EMA prev | EMA prev2 | | 5 day EMA | 16.28 | 16.4 | 16.53 | | 12 day EMA | 16.92 | 17.08 | 17.25 | | 20 day EMA | 17.32 | 17.45 | 17.59 | | 35 day EMA | 17.42 | 17.5 | 17.58 | | 50 day EMA | 17.34 | 17.39 | 17.44 |
SMA (simple moving average) of Maui Land MLP
| SMA period | SMA current | SMA prev | SMA prev2 | | 5 day SMA | 16.18 | 16.34 | 16.57 | | 12 day SMA | 17.04 | 17.28 | 17.52 | | 20 day SMA | 17.91 | 18.08 | 18.24 | | 35 day SMA | 17.88 | 17.91 | 17.94 | | 50 day SMA | 17.56 | 17.57 | 17.58 | | 100 day SMA | 17.35 | 17.35 | 17.35 | | 150 day SMA | 16.94 | 16.95 | 16.96 | | 200 day SMA | 17.68 | 17.7 | 17.73 |
|
|
