MfsIntermediate MIN full analysis,charts,indicators,moving averages,SMA,DMA,EMA,ADX,MACD,RSIMfs Intermediate MIN WideScreen charts, DMA,SMA,EMA technical analysis, forecast prediction, by indicators ADX,MACD,RSI,CCI NYSE stock exchange
operates under N A sector & deals in N A
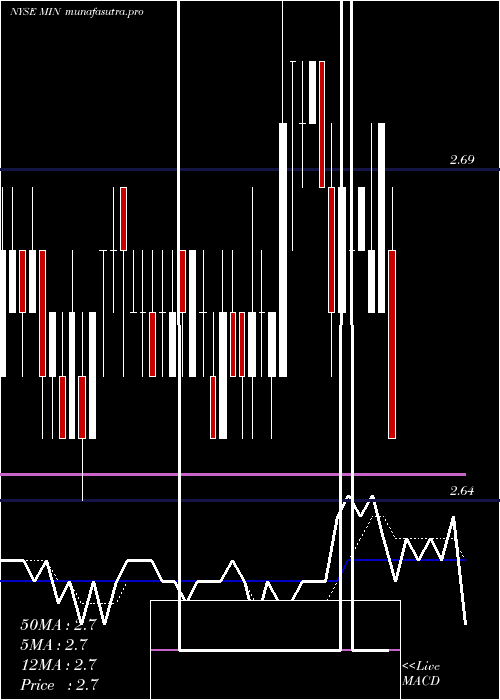
Daily price and charts and targets MfsIntermediate Strong Daily Stock price targets for MfsIntermediate MIN are 2.64 and 2.67 | Daily Target 1 | 2.63 | | Daily Target 2 | 2.64 | | Daily Target 3 | 2.6566666666667 | | Daily Target 4 | 2.67 | | Daily Target 5 | 2.69 |
Daily price and volume Mfs Intermediate
| Date |
Closing |
Open |
Range |
Volume |
Thu 04 December 2025 |
2.66 (0.38%) |
2.67 |
2.64 - 2.67 |
1.5699 times |
Wed 03 December 2025 |
2.65 (-0.38%) |
2.64 |
2.64 - 2.66 |
0.6757 times |
Tue 02 December 2025 |
2.66 (0%) |
2.64 |
2.64 - 2.66 |
0.9999 times |
Mon 01 December 2025 |
2.66 (0%) |
2.64 |
2.64 - 2.66 |
0.9075 times |
Fri 28 November 2025 |
2.66 (0%) |
2.67 |
2.65 - 2.67 |
0.4733 times |
Wed 26 November 2025 |
2.66 (0.38%) |
2.66 |
2.64 - 2.66 |
1.1858 times |
Tue 25 November 2025 |
2.65 (0%) |
2.65 |
2.64 - 2.65 |
0.5833 times |
Mon 24 November 2025 |
2.65 (-0.38%) |
2.66 |
2.64 - 2.66 |
1.1094 times |
Fri 21 November 2025 |
2.66 (0%) |
2.66 |
2.63 - 2.67 |
1.5678 times |
Thu 20 November 2025 |
2.66 (0%) |
2.65 |
2.65 - 2.67 |
0.9273 times |
Wed 19 November 2025 |
2.66 (0%) |
2.65 |
2.64 - 2.67 |
1.6116 times |
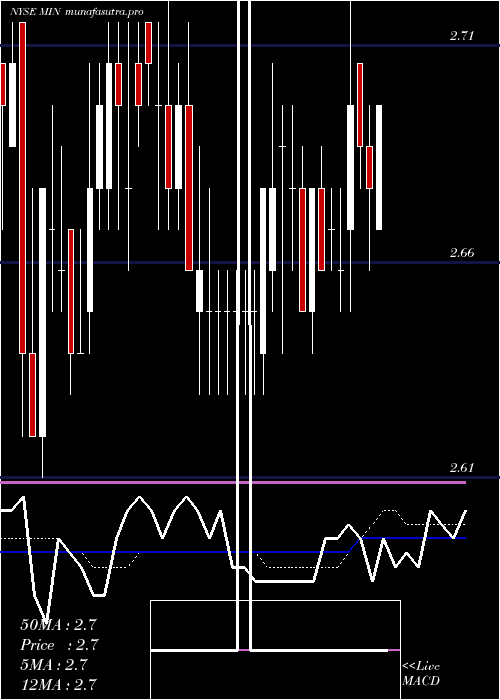
Weekly price and charts MfsIntermediate Strong weekly Stock price targets for MfsIntermediate MIN are 2.65 and 2.68 | Weekly Target 1 | 2.63 | | Weekly Target 2 | 2.64 | | Weekly Target 3 | 2.6566666666667 | | Weekly Target 4 | 2.67 | | Weekly Target 5 | 2.69 |
Weekly price and volumes for Mfs Intermediate
| Date |
Closing |
Open |
Range |
Volume |
Thu 04 December 2025 |
2.66 (0%) |
2.64 |
2.64 - 2.67 |
0.6989 times |
Fri 28 November 2025 |
2.66 (0%) |
2.66 |
2.64 - 2.67 |
0.564 times |
Fri 21 November 2025 |
2.66 (1.14%) |
2.63 |
2.61 - 2.67 |
2.165 times |
Fri 14 November 2025 |
2.63 (0.77%) |
2.61 |
2.60 - 2.64 |
1.0403 times |
Fri 07 November 2025 |
2.61 (0%) |
2.60 |
2.60 - 2.63 |
0.6508 times |
Fri 31 October 2025 |
2.61 (0%) |
2.61 |
2.60 - 2.62 |
0.2598 times |
Fri 31 October 2025 |
2.61 (-0.38%) |
2.62 |
2.59 - 2.63 |
1.0823 times |
Fri 24 October 2025 |
2.62 (-0.76%) |
2.64 |
2.60 - 2.65 |
1.2434 times |
Fri 17 October 2025 |
2.64 (-0.75%) |
2.65 |
2.63 - 2.67 |
0.8948 times |
Fri 10 October 2025 |
2.66 (0%) |
2.67 |
2.65 - 2.68 |
1.4007 times |
Fri 03 October 2025 |
2.66 (-0.37%) |
2.67 |
2.66 - 2.68 |
0.7915 times |
Monthly price and charts MfsIntermediate Strong monthly Stock price targets for MfsIntermediate MIN are 2.65 and 2.68 | Monthly Target 1 | 2.63 | | Monthly Target 2 | 2.64 | | Monthly Target 3 | 2.6566666666667 | | Monthly Target 4 | 2.67 | | Monthly Target 5 | 2.69 |
Monthly price and volumes Mfs Intermediate
| Date |
Closing |
Open |
Range |
Volume |
Thu 04 December 2025 |
2.66 (0%) |
2.64 |
2.64 - 2.67 |
0.1911 times |
Fri 28 November 2025 |
2.66 (1.92%) |
2.60 |
2.60 - 2.67 |
1.2084 times |
Fri 31 October 2025 |
2.61 (-2.61%) |
2.67 |
2.59 - 2.68 |
1.473 times |
Tue 30 September 2025 |
2.68 (-0.37%) |
2.69 |
2.66 - 2.73 |
1.468 times |
Fri 29 August 2025 |
2.69 (0%) |
2.69 |
2.65 - 2.72 |
0.838 times |
Thu 31 July 2025 |
2.69 (-0.74%) |
2.70 |
2.63 - 2.71 |
0.8813 times |
Mon 30 June 2025 |
2.71 (1.12%) |
2.68 |
2.65 - 2.73 |
0.6903 times |
Fri 30 May 2025 |
2.68 (-0.37%) |
2.68 |
2.64 - 2.71 |
0.8922 times |
Wed 30 April 2025 |
2.69 (0%) |
2.69 |
2.63 - 2.72 |
1.262 times |
Mon 31 March 2025 |
2.69 (-0.37%) |
2.72 |
2.67 - 2.73 |
1.0957 times |
Fri 28 February 2025 |
2.70 (0%) |
2.68 |
2.66 - 2.72 |
0.7598 times |

DMA SMA EMA moving averages of Mfs Intermediate MIN
DMA (daily moving average) of Mfs Intermediate MIN
| DMA period | DMA value | | 5 day DMA | 2.66 | | 12 day DMA | 2.66 | | 20 day DMA | 2.65 | | 35 day DMA | 2.63 | | 50 day DMA | 2.64 | | 100 day DMA | 2.66 | | 150 day DMA | 2.67 | | 200 day DMA | 2.67 | EMA (exponential moving average) of Mfs Intermediate MIN
| EMA period | EMA current | EMA prev | EMA prev2 | | 5 day EMA | 2.65 | 2.65 | 2.65 | | 12 day EMA | 2.63 | 2.63 | 2.63 | | 20 day EMA | 2.65 | 2.65 | 2.65 | | 35 day EMA | 2.65 | 2.65 | 2.65 | | 50 day EMA | 2.64 | 2.64 | 2.64 |
SMA (simple moving average) of Mfs Intermediate MIN
| SMA period | SMA current | SMA prev | SMA prev2 | | 5 day SMA | 2.66 | 2.66 | 2.66 | | 12 day SMA | 2.66 | 2.66 | 2.65 | | 20 day SMA | 2.65 | 2.64 | 2.64 | | 35 day SMA | 2.63 | 2.63 | 2.63 | | 50 day SMA | 2.64 | 2.64 | 2.64 | | 100 day SMA | 2.66 | 2.66 | 2.66 | | 150 day SMA | 2.67 | 2.67 | 2.67 | | 200 day SMA | 2.67 | 2.67 | 2.67 |
|
|
