BlackrockMuniholdings MHN full analysis,charts,indicators,moving averages,SMA,DMA,EMA,ADX,MACD,RSIBlackrock Muniholdings MHN WideScreen charts, DMA,SMA,EMA technical analysis, forecast prediction, by indicators ADX,MACD,RSI,CCI NYSE stock exchange
operates under N A sector & deals in N A
Daily price and charts and targets BlackrockMuniholdings Strong Daily Stock price targets for BlackrockMuniholdings MHN are 10.29 and 10.41 | Daily Target 1 | 10.26 | | Daily Target 2 | 10.31 | | Daily Target 3 | 10.376666666667 | | Daily Target 4 | 10.43 | | Daily Target 5 | 10.5 |
Daily price and volume Blackrock Muniholdings
| Date |
Closing |
Open |
Range |
Volume |
Thu 04 December 2025 |
10.37 (-0.86%) |
10.44 |
10.32 - 10.44 |
1.0068 times |
Wed 03 December 2025 |
10.46 (1.85%) |
10.25 |
10.25 - 10.51 |
3.4051 times |
Tue 02 December 2025 |
10.27 (-0.39%) |
10.28 |
10.24 - 10.29 |
1.0024 times |
Mon 01 December 2025 |
10.31 (0.1%) |
10.28 |
10.23 - 10.31 |
1.2367 times |
Fri 28 November 2025 |
10.30 (-0.1%) |
10.30 |
10.30 - 10.36 |
0.2373 times |
Wed 26 November 2025 |
10.31 (-0.96%) |
10.37 |
10.31 - 10.42 |
0.367 times |
Tue 25 November 2025 |
10.41 (0.97%) |
10.36 |
10.32 - 10.44 |
0.6397 times |
Mon 24 November 2025 |
10.31 (0.39%) |
10.27 |
10.27 - 10.34 |
0.4452 times |
Fri 21 November 2025 |
10.27 (0.29%) |
10.24 |
10.23 - 10.27 |
0.594 times |
Thu 20 November 2025 |
10.24 (0%) |
10.28 |
10.21 - 10.30 |
1.0657 times |
Wed 19 November 2025 |
10.24 (-0.68%) |
10.26 |
10.24 - 10.32 |
0.8712 times |
Weekly price and charts BlackrockMuniholdings Strong weekly Stock price targets for BlackrockMuniholdings MHN are 10.3 and 10.58 | Weekly Target 1 | 10.09 | | Weekly Target 2 | 10.23 | | Weekly Target 3 | 10.37 | | Weekly Target 4 | 10.51 | | Weekly Target 5 | 10.65 |
Weekly price and volumes for Blackrock Muniholdings
| Date |
Closing |
Open |
Range |
Volume |
Thu 04 December 2025 |
10.37 (0.68%) |
10.28 |
10.23 - 10.51 |
2.076 times |
Fri 28 November 2025 |
10.30 (0.29%) |
10.27 |
10.27 - 10.44 |
0.5273 times |
Fri 21 November 2025 |
10.27 (0.59%) |
10.27 |
10.21 - 10.34 |
1.3371 times |
Fri 14 November 2025 |
10.21 (-0.29%) |
10.26 |
10.19 - 10.36 |
1.6537 times |
Fri 07 November 2025 |
10.24 (-1.63%) |
10.32 |
10.22 - 10.36 |
1.1402 times |
Fri 31 October 2025 |
10.41 (0%) |
10.32 |
10.32 - 10.41 |
0.2103 times |
Fri 31 October 2025 |
10.41 (-0.57%) |
10.49 |
10.30 - 10.50 |
1.3325 times |
Fri 24 October 2025 |
10.47 (0.58%) |
10.46 |
10.43 - 10.51 |
0.4988 times |
Fri 17 October 2025 |
10.41 (-0.76%) |
10.44 |
10.39 - 10.54 |
0.6644 times |
Tue 07 October 2025 |
10.49 (1.45%) |
10.31 |
10.31 - 10.49 |
0.5598 times |
Fri 03 October 2025 |
10.34 (2.17%) |
10.12 |
10.10 - 10.37 |
1.0043 times |

Monthly price and charts BlackrockMuniholdings Strong monthly Stock price targets for BlackrockMuniholdings MHN are 10.3 and 10.58 | Monthly Target 1 | 10.09 | | Monthly Target 2 | 10.23 | | Monthly Target 3 | 10.37 | | Monthly Target 4 | 10.51 | | Monthly Target 5 | 10.65 |
Monthly price and volumes Blackrock Muniholdings
| Date |
Closing |
Open |
Range |
Volume |
Thu 04 December 2025 |
10.37 (0.68%) |
10.28 |
10.23 - 10.51 |
0.3603 times |
Fri 28 November 2025 |
10.30 (-1.06%) |
10.32 |
10.19 - 10.44 |
0.8084 times |
Fri 31 October 2025 |
10.41 (1.86%) |
10.24 |
10.21 - 10.54 |
0.6814 times |
Tue 30 September 2025 |
10.22 (6.02%) |
9.62 |
9.52 - 10.27 |
2.2584 times |
Fri 29 August 2025 |
9.64 (1.37%) |
9.51 |
9.50 - 9.90 |
0.8131 times |
Thu 31 July 2025 |
9.51 (-3.16%) |
9.82 |
9.39 - 9.92 |
1.2035 times |
Mon 30 June 2025 |
9.82 (0.51%) |
9.78 |
9.64 - 9.87 |
0.9336 times |
Fri 30 May 2025 |
9.77 (-1.71%) |
10.03 |
9.70 - 10.09 |
0.7937 times |
Wed 30 April 2025 |
9.94 (-2.07%) |
10.18 |
9.52 - 10.37 |
1.1522 times |
Mon 31 March 2025 |
10.15 (-4.06%) |
10.54 |
10.05 - 10.64 |
0.9955 times |
Fri 28 February 2025 |
10.58 (1.93%) |
10.38 |
10.36 - 10.60 |
1.202 times |

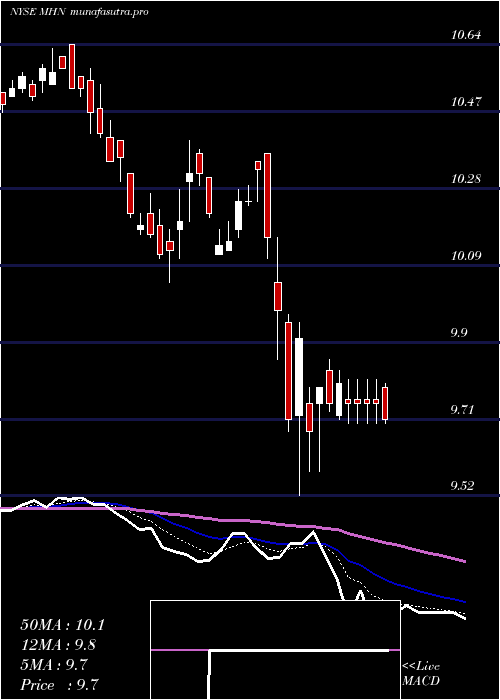
DMA SMA EMA moving averages of Blackrock Muniholdings MHN
DMA (daily moving average) of Blackrock Muniholdings MHN
| DMA period | DMA value | | 5 day DMA | 10.34 | | 12 day DMA | 10.32 | | 20 day DMA | 10.31 | | 35 day DMA | 10.35 | | 50 day DMA | 10.33 | | 100 day DMA | 10.03 | | 150 day DMA | 9.96 | | 200 day DMA | 10.02 | EMA (exponential moving average) of Blackrock Muniholdings MHN
| EMA period | EMA current | EMA prev | EMA prev2 | | 5 day EMA | 10.36 | 10.35 | 10.3 | | 12 day EMA | 10.33 | 10.32 | 10.3 | | 20 day EMA | 10.33 | 10.33 | 10.32 | | 35 day EMA | 10.34 | 10.34 | 10.33 | | 50 day EMA | 10.33 | 10.33 | 10.32 |
SMA (simple moving average) of Blackrock Muniholdings MHN
| SMA period | SMA current | SMA prev | SMA prev2 | | 5 day SMA | 10.34 | 10.33 | 10.32 | | 12 day SMA | 10.32 | 10.31 | 10.29 | | 20 day SMA | 10.31 | 10.3 | 10.3 | | 35 day SMA | 10.35 | 10.36 | 10.36 | | 50 day SMA | 10.33 | 10.33 | 10.33 | | 100 day SMA | 10.03 | 10.02 | 10.01 | | 150 day SMA | 9.96 | 9.96 | 9.96 | | 200 day SMA | 10.02 | 10.02 | 10.02 |
|
|
