MagnoliaOil MGY full analysis,charts,indicators,moving averages,SMA,DMA,EMA,ADX,MACD,RSIMagnolia Oil MGY WideScreen charts, DMA,SMA,EMA technical analysis, forecast prediction, by indicators ADX,MACD,RSI,CCI NYSE stock exchange
operates under Energy sector & deals in Oil Gas Production
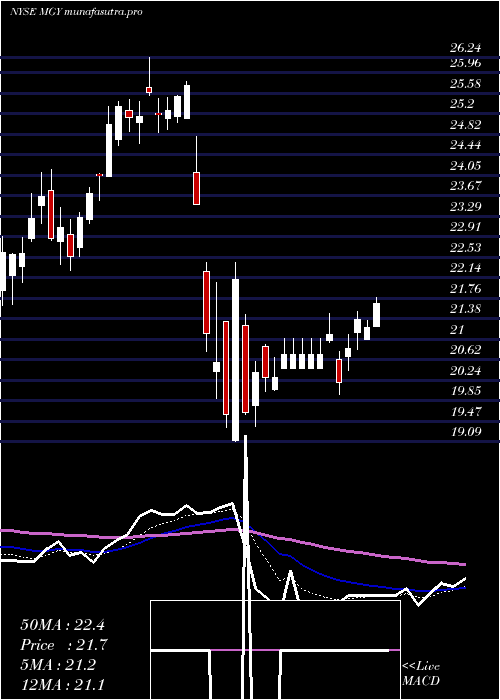
Daily price and charts and targets MagnoliaOil Strong Daily Stock price targets for MagnoliaOil MGY are 23.23 and 23.55 | Daily Target 1 | 23.17 | | Daily Target 2 | 23.29 | | Daily Target 3 | 23.49 | | Daily Target 4 | 23.61 | | Daily Target 5 | 23.81 |
Daily price and volume Magnolia Oil
| Date |
Closing |
Open |
Range |
Volume |
Thu 04 December 2025 |
23.41 (-0.34%) |
23.51 |
23.37 - 23.69 |
0.8889 times |
Wed 03 December 2025 |
23.49 (2.53%) |
23.14 |
23.04 - 23.68 |
1.0296 times |
Tue 02 December 2025 |
22.91 (-2.59%) |
23.41 |
22.90 - 23.60 |
1.1062 times |
Mon 01 December 2025 |
23.52 (1.64%) |
23.07 |
23.04 - 23.66 |
0.8948 times |
Fri 28 November 2025 |
23.14 (0.92%) |
22.95 |
22.95 - 23.27 |
0.3228 times |
Wed 26 November 2025 |
22.93 (-0.17%) |
22.88 |
22.88 - 23.28 |
1.3968 times |
Tue 25 November 2025 |
22.97 (-0.48%) |
22.43 |
22.43 - 23.07 |
0.919 times |
Mon 24 November 2025 |
23.08 (1.27%) |
22.59 |
22.36 - 23.20 |
0.8425 times |
Fri 21 November 2025 |
22.79 (1.97%) |
22.29 |
22.10 - 22.93 |
0.9512 times |
Thu 20 November 2025 |
22.35 (-1.24%) |
22.74 |
22.29 - 23.27 |
1.6483 times |
Wed 19 November 2025 |
22.63 (-0.26%) |
22.19 |
22.02 - 22.71 |
1.3347 times |
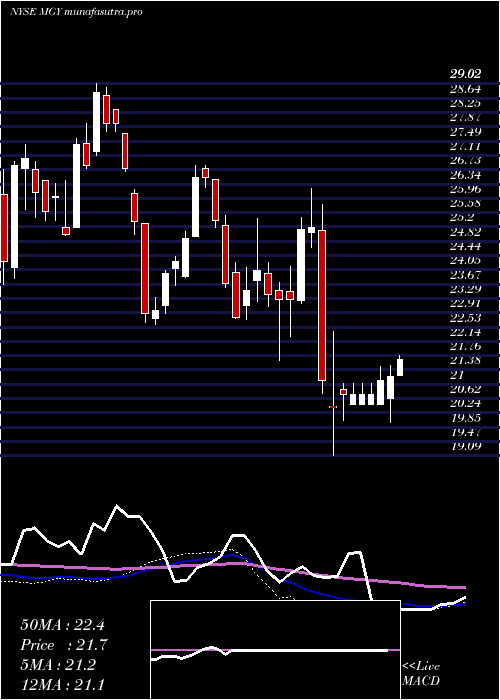
Weekly price and charts MagnoliaOil Strong weekly Stock price targets for MagnoliaOil MGY are 23.16 and 23.95 | Weekly Target 1 | 22.54 | | Weekly Target 2 | 22.98 | | Weekly Target 3 | 23.333333333333 | | Weekly Target 4 | 23.77 | | Weekly Target 5 | 24.12 |
Weekly price and volumes for Magnolia Oil
| Date |
Closing |
Open |
Range |
Volume |
Thu 04 December 2025 |
23.41 (1.17%) |
23.07 |
22.90 - 23.69 |
0.8524 times |
Fri 28 November 2025 |
23.14 (1.54%) |
22.59 |
22.36 - 23.28 |
0.7571 times |
Fri 21 November 2025 |
22.79 (-0.91%) |
22.91 |
22.02 - 23.27 |
1.3214 times |
Fri 14 November 2025 |
23.00 (4.69%) |
21.94 |
21.81 - 23.13 |
1.2113 times |
Fri 07 November 2025 |
21.97 (-2.18%) |
22.02 |
21.30 - 22.12 |
1.389 times |
Fri 31 October 2025 |
22.46 (0%) |
22.45 |
22.20 - 22.69 |
0.3277 times |
Fri 31 October 2025 |
22.46 (-3.61%) |
23.62 |
22.20 - 23.62 |
1.5321 times |
Fri 24 October 2025 |
23.30 (2.15%) |
22.94 |
22.64 - 23.75 |
1.0125 times |
Fri 17 October 2025 |
22.81 (-4.6%) |
23.06 |
22.39 - 23.63 |
1.1797 times |
Tue 07 October 2025 |
23.91 (1.14%) |
25.64 |
23.48 - 25.64 |
0.4168 times |
Fri 03 October 2025 |
23.64 (-6.41%) |
25.11 |
23.09 - 25.11 |
1.2824 times |
Monthly price and charts MagnoliaOil Strong monthly Stock price targets for MagnoliaOil MGY are 23.16 and 23.95 | Monthly Target 1 | 22.54 | | Monthly Target 2 | 22.98 | | Monthly Target 3 | 23.333333333333 | | Monthly Target 4 | 23.77 | | Monthly Target 5 | 24.12 |
Monthly price and volumes Magnolia Oil
| Date |
Closing |
Open |
Range |
Volume |
Thu 04 December 2025 |
23.41 (1.17%) |
23.07 |
22.90 - 23.69 |
0.1522 times |
Fri 28 November 2025 |
23.14 (3.03%) |
22.02 |
21.30 - 23.28 |
0.8356 times |
Fri 31 October 2025 |
22.46 (-5.91%) |
23.78 |
22.20 - 25.64 |
0.9141 times |
Tue 30 September 2025 |
23.87 (-4.06%) |
24.56 |
23.28 - 25.45 |
1.0576 times |
Fri 29 August 2025 |
24.88 (4.45%) |
23.87 |
22.85 - 25.13 |
0.9569 times |
Thu 31 July 2025 |
23.82 (5.96%) |
22.41 |
22.20 - 24.77 |
1.1289 times |
Mon 30 June 2025 |
22.48 (4.56%) |
22.10 |
21.49 - 24.66 |
1.1392 times |
Fri 30 May 2025 |
21.50 (4.72%) |
20.92 |
20.40 - 23.53 |
0.9679 times |
Wed 30 April 2025 |
20.53 (-18.73%) |
25.14 |
19.09 - 25.80 |
1.2047 times |
Mon 31 March 2025 |
25.26 (7.9%) |
23.50 |
21.63 - 26.24 |
1.6427 times |
Fri 28 February 2025 |
23.41 (-1.22%) |
23.98 |
22.74 - 25.42 |
0.886 times |

DMA SMA EMA moving averages of Magnolia Oil MGY
DMA (daily moving average) of Magnolia Oil MGY
| DMA period | DMA value | | 5 day DMA | 23.29 | | 12 day DMA | 22.99 | | 20 day DMA | 22.77 | | 35 day DMA | 22.74 | | 50 day DMA | 23.11 | | 100 day DMA | 23.49 | | 150 day DMA | 23.17 | | 200 day DMA | 23.07 | EMA (exponential moving average) of Magnolia Oil MGY
| EMA period | EMA current | EMA prev | EMA prev2 | | 5 day EMA | 23.28 | 23.21 | 23.07 | | 12 day EMA | 23.06 | 23 | 22.91 | | 20 day EMA | 22.97 | 22.92 | 22.86 | | 35 day EMA | 23.08 | 23.06 | 23.03 | | 50 day EMA | 23.24 | 23.23 | 23.22 |
SMA (simple moving average) of Magnolia Oil MGY
| SMA period | SMA current | SMA prev | SMA prev2 | | 5 day SMA | 23.29 | 23.2 | 23.09 | | 12 day SMA | 22.99 | 22.9 | 22.86 | | 20 day SMA | 22.77 | 22.67 | 22.59 | | 35 day SMA | 22.74 | 22.74 | 22.73 | | 50 day SMA | 23.11 | 23.13 | 23.15 | | 100 day SMA | 23.49 | 23.49 | 23.49 | | 150 day SMA | 23.17 | 23.16 | 23.14 | | 200 day SMA | 23.07 | 23.07 | 23.06 |
|
|
