MfsGovernment MGF full analysis,charts,indicators,moving averages,SMA,DMA,EMA,ADX,MACD,RSIMfs Government MGF WideScreen charts, DMA,SMA,EMA technical analysis, forecast prediction, by indicators ADX,MACD,RSI,CCI NYSE stock exchange
operates under N A sector & deals in N A
Daily price and charts and targets MfsGovernment Strong Daily Stock price targets for MfsGovernment MGF are 3.06 and 3.09 | Daily Target 1 | 3.05 | | Daily Target 2 | 3.06 | | Daily Target 3 | 3.08 | | Daily Target 4 | 3.09 | | Daily Target 5 | 3.11 |
Daily price and volume Mfs Government
| Date |
Closing |
Open |
Range |
Volume |
Fri 05 December 2025 |
3.07 (-1.29%) |
3.09 |
3.07 - 3.10 |
1.1702 times |
Thu 04 December 2025 |
3.11 (0.65%) |
3.09 |
3.09 - 3.11 |
0.5027 times |
Wed 03 December 2025 |
3.09 (-0.96%) |
3.09 |
3.09 - 3.11 |
0.6968 times |
Tue 02 December 2025 |
3.12 (0%) |
3.11 |
3.11 - 3.12 |
1.3883 times |
Mon 01 December 2025 |
3.12 (-0.32%) |
3.12 |
3.11 - 3.12 |
0.4362 times |
Fri 28 November 2025 |
3.13 (0.97%) |
3.11 |
3.09 - 3.13 |
3.2926 times |
Wed 26 November 2025 |
3.10 (-0.32%) |
3.09 |
3.09 - 3.11 |
0.5745 times |
Tue 25 November 2025 |
3.11 (0.65%) |
3.10 |
3.10 - 3.11 |
0.3032 times |
Mon 24 November 2025 |
3.09 (0.65%) |
3.08 |
3.07 - 3.10 |
1.1543 times |
Fri 21 November 2025 |
3.07 (-1.29%) |
3.11 |
3.07 - 3.11 |
0.4814 times |
Thu 20 November 2025 |
3.11 (0.97%) |
3.08 |
3.08 - 3.11 |
1.6782 times |
Weekly price and charts MfsGovernment Strong weekly Stock price targets for MfsGovernment MGF are 3.05 and 3.1 | Weekly Target 1 | 3.04 | | Weekly Target 2 | 3.05 | | Weekly Target 3 | 3.0866666666667 | | Weekly Target 4 | 3.1 | | Weekly Target 5 | 3.14 |
Weekly price and volumes for Mfs Government
| Date |
Closing |
Open |
Range |
Volume |
Fri 05 December 2025 |
3.07 (-1.92%) |
3.12 |
3.07 - 3.12 |
0.9242 times |
Fri 28 November 2025 |
3.13 (1.95%) |
3.08 |
3.07 - 3.13 |
1.1733 times |
Fri 21 November 2025 |
3.07 (-1.29%) |
3.11 |
3.07 - 3.11 |
1.1463 times |
Fri 14 November 2025 |
3.11 (0.97%) |
3.08 |
3.05 - 3.12 |
1.7646 times |
Fri 07 November 2025 |
3.08 (0.33%) |
3.05 |
3.05 - 3.10 |
0.9424 times |
Fri 31 October 2025 |
3.07 (0%) |
3.07 |
3.05 - 3.07 |
0.1928 times |
Fri 31 October 2025 |
3.07 (-0.32%) |
3.07 |
3.03 - 3.09 |
1.5987 times |
Fri 24 October 2025 |
3.08 (0.65%) |
3.06 |
3.04 - 3.10 |
1.2487 times |
Fri 17 October 2025 |
3.06 (-0.33%) |
3.09 |
3.06 - 3.10 |
0.5099 times |
Tue 07 October 2025 |
3.07 (-1.29%) |
3.09 |
3.07 - 3.11 |
0.4991 times |
Fri 03 October 2025 |
3.11 (0.32%) |
3.13 |
3.09 - 3.13 |
1.4781 times |

Monthly price and charts MfsGovernment Strong monthly Stock price targets for MfsGovernment MGF are 3.05 and 3.1 | Monthly Target 1 | 3.04 | | Monthly Target 2 | 3.05 | | Monthly Target 3 | 3.0866666666667 | | Monthly Target 4 | 3.1 | | Monthly Target 5 | 3.14 |
Monthly price and volumes Mfs Government
| Date |
Closing |
Open |
Range |
Volume |
Fri 05 December 2025 |
3.07 (-1.92%) |
3.12 |
3.07 - 3.12 |
0.1381 times |
Fri 28 November 2025 |
3.13 (1.95%) |
3.05 |
3.05 - 3.13 |
0.751 times |
Fri 31 October 2025 |
3.07 (-1.6%) |
3.12 |
3.03 - 3.13 |
0.7739 times |
Tue 30 September 2025 |
3.12 (0.97%) |
3.08 |
3.06 - 3.13 |
1.0319 times |
Fri 29 August 2025 |
3.09 (0.65%) |
3.07 |
2.99 - 3.14 |
1.3441 times |
Thu 31 July 2025 |
3.07 (-1.6%) |
3.10 |
3.04 - 3.14 |
1.5817 times |
Mon 30 June 2025 |
3.12 (1.63%) |
3.06 |
3.03 - 3.13 |
0.8529 times |
Fri 30 May 2025 |
3.07 (-2.54%) |
3.14 |
3.03 - 3.15 |
1.9782 times |
Wed 30 April 2025 |
3.15 (-0.63%) |
3.16 |
3.03 - 3.17 |
0.7953 times |
Mon 31 March 2025 |
3.17 (1.6%) |
3.10 |
3.09 - 3.17 |
0.7529 times |
Fri 28 February 2025 |
3.12 (0.97%) |
3.07 |
3.04 - 3.17 |
0.6263 times |

DMA SMA EMA moving averages of Mfs Government MGF
DMA (daily moving average) of Mfs Government MGF
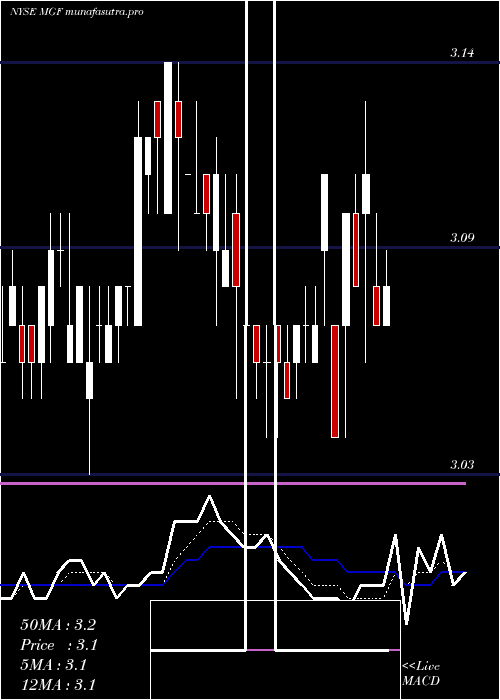
| DMA period | DMA value | | 5 day DMA | 3.1 | | 12 day DMA | 3.1 | | 20 day DMA | 3.1 | | 35 day DMA | 3.08 | | 50 day DMA | 3.09 | | 100 day DMA | 3.09 | | 150 day DMA | 3.09 | | 200 day DMA | 3.09 | EMA (exponential moving average) of Mfs Government MGF
| EMA period | EMA current | EMA prev | EMA prev2 | | 5 day EMA | 3.09 | 3.1 | 3.1 | | 12 day EMA | 3.09 | 3.09 | 3.09 | | 20 day EMA | 3.09 | 3.09 | 3.09 | | 35 day EMA | 3.08 | 3.08 | 3.08 | | 50 day EMA | 3.09 | 3.09 | 3.09 |
SMA (simple moving average) of Mfs Government MGF
| SMA period | SMA current | SMA prev | SMA prev2 | | 5 day SMA | 3.1 | 3.11 | 3.11 | | 12 day SMA | 3.1 | 3.1 | 3.1 | | 20 day SMA | 3.1 | 3.1 | 3.09 | | 35 day SMA | 3.08 | 3.09 | 3.08 | | 50 day SMA | 3.09 | 3.09 | 3.09 | | 100 day SMA | 3.09 | 3.09 | 3.09 | | 150 day SMA | 3.09 | 3.09 | 3.09 | | 200 day SMA | 3.09 | 3.09 | 3.09 |
|
|
