MfsMunicipal MFM full analysis,charts,indicators,moving averages,SMA,DMA,EMA,ADX,MACD,RSIMfs Municipal MFM WideScreen charts, DMA,SMA,EMA technical analysis, forecast prediction, by indicators ADX,MACD,RSI,CCI NYSE stock exchange
operates under N A sector & deals in N A
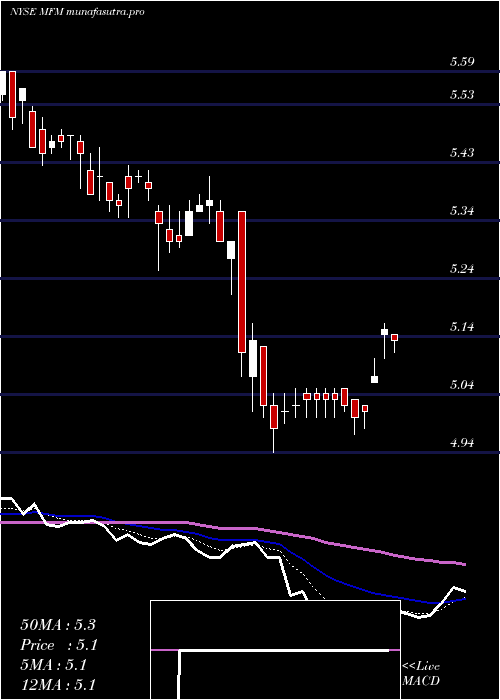
Daily price and charts and targets MfsMunicipal Strong Daily Stock price targets for MfsMunicipal MFM are 5.41 and 5.45 | Daily Target 1 | 5.37 | | Daily Target 2 | 5.4 | | Daily Target 3 | 5.4133333333333 | | Daily Target 4 | 5.44 | | Daily Target 5 | 5.45 |
Daily price and volume Mfs Municipal
| Date |
Closing |
Open |
Range |
Volume |
Mon 20 October 2025 |
5.42 (0.74%) |
5.41 |
5.39 - 5.43 |
1.2443 times |
Fri 17 October 2025 |
5.38 (-0.19%) |
5.40 |
5.38 - 5.43 |
1.0189 times |
Thu 16 October 2025 |
5.39 (-1.64%) |
5.46 |
5.39 - 5.46 |
1.053 times |
Wed 15 October 2025 |
5.48 (1.48%) |
5.35 |
5.35 - 5.48 |
0.8431 times |
Tue 14 October 2025 |
5.40 (0%) |
5.37 |
5.37 - 5.41 |
0.3638 times |
Mon 13 October 2025 |
5.40 (0.93%) |
5.40 |
5.40 - 5.42 |
0.5606 times |
Tue 07 October 2025 |
5.35 (0.38%) |
5.32 |
5.32 - 5.40 |
1.4146 times |
Mon 06 October 2025 |
5.33 (0.38%) |
5.31 |
5.29 - 5.35 |
0.7614 times |
Fri 03 October 2025 |
5.31 (-0.56%) |
5.41 |
5.31 - 5.41 |
1.319 times |
Thu 02 October 2025 |
5.34 (-0.56%) |
5.36 |
5.34 - 5.38 |
1.4213 times |
Wed 01 October 2025 |
5.37 (-0.37%) |
5.36 |
5.36 - 5.40 |
2.161 times |
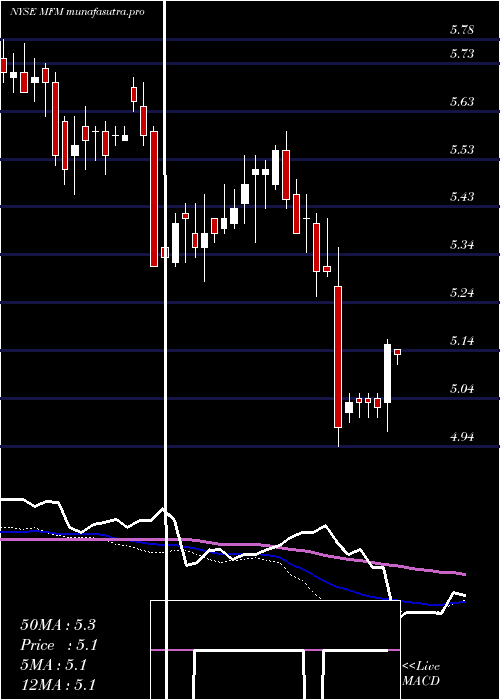
Weekly price and charts MfsMunicipal Strong weekly Stock price targets for MfsMunicipal MFM are 5.41 and 5.45 | Weekly Target 1 | 5.37 | | Weekly Target 2 | 5.4 | | Weekly Target 3 | 5.4133333333333 | | Weekly Target 4 | 5.44 | | Weekly Target 5 | 5.45 |
Weekly price and volumes for Mfs Municipal
| Date |
Closing |
Open |
Range |
Volume |
Mon 20 October 2025 |
5.42 (0.74%) |
5.41 |
5.39 - 5.43 |
0.2418 times |
Fri 17 October 2025 |
5.38 (0.56%) |
5.40 |
5.35 - 5.48 |
0.7461 times |
Tue 07 October 2025 |
5.35 (0.75%) |
5.31 |
5.29 - 5.40 |
0.4229 times |
Fri 03 October 2025 |
5.31 (-0.38%) |
5.34 |
5.30 - 5.41 |
1.3839 times |
Fri 26 September 2025 |
5.33 (-0.56%) |
5.32 |
5.22 - 5.37 |
1.2139 times |
Fri 19 September 2025 |
5.36 (0.56%) |
5.35 |
5.27 - 5.38 |
1.1765 times |
Fri 12 September 2025 |
5.33 (3.09%) |
5.20 |
5.19 - 5.38 |
1.7122 times |
Fri 05 September 2025 |
5.17 (-0.39%) |
5.17 |
5.13 - 5.20 |
1.2871 times |
Fri 29 August 2025 |
5.19 (0%) |
5.18 |
5.15 - 5.19 |
0.4462 times |
Fri 29 August 2025 |
5.19 (1.17%) |
5.11 |
5.07 - 5.19 |
1.3696 times |
Fri 22 August 2025 |
5.13 (0%) |
5.12 |
5.03 - 5.13 |
1.7216 times |
Monthly price and charts MfsMunicipal Strong monthly Stock price targets for MfsMunicipal MFM are 5.36 and 5.55 | Monthly Target 1 | 5.21 | | Monthly Target 2 | 5.31 | | Monthly Target 3 | 5.3966666666667 | | Monthly Target 4 | 5.5 | | Monthly Target 5 | 5.59 |
Monthly price and volumes Mfs Municipal
| Date |
Closing |
Open |
Range |
Volume |
Mon 20 October 2025 |
5.42 (0.56%) |
5.36 |
5.29 - 5.48 |
0.414 times |
Tue 30 September 2025 |
5.39 (3.85%) |
5.17 |
5.13 - 5.39 |
1.0198 times |
Fri 29 August 2025 |
5.19 (1.17%) |
5.12 |
5.03 - 5.24 |
1.0926 times |
Thu 31 July 2025 |
5.13 (-0.77%) |
5.18 |
5.03 - 5.23 |
1.6012 times |
Mon 30 June 2025 |
5.17 (0.98%) |
5.10 |
5.05 - 5.20 |
1.0995 times |
Fri 30 May 2025 |
5.12 (-1.16%) |
5.18 |
5.03 - 5.29 |
1.0563 times |
Wed 30 April 2025 |
5.18 (-2.26%) |
5.31 |
4.94 - 5.41 |
1.5122 times |
Mon 31 March 2025 |
5.30 (-4.5%) |
5.55 |
5.25 - 5.59 |
0.7476 times |
Fri 28 February 2025 |
5.55 (2.21%) |
5.44 |
5.36 - 5.56 |
0.7439 times |
Fri 31 January 2025 |
5.43 (1.5%) |
5.36 |
5.28 - 5.48 |
0.7129 times |
Tue 31 December 2024 |
5.35 (-4.12%) |
5.68 |
5.25 - 5.70 |
0.9003 times |

DMA SMA EMA moving averages of Mfs Municipal MFM
DMA (daily moving average) of Mfs Municipal MFM
| DMA period | DMA value | | 5 day DMA | 5.41 | | 12 day DMA | 5.38 | | 20 day DMA | 5.36 | | 35 day DMA | 5.32 | | 50 day DMA | 5.26 | | 100 day DMA | 5.19 | | 150 day DMA | 5.19 | | 200 day DMA | 5.25 | EMA (exponential moving average) of Mfs Municipal MFM
| EMA period | EMA current | EMA prev | EMA prev2 | | 5 day EMA | 5.4 | 5.39 | 5.4 | | 12 day EMA | 5.39 | 5.38 | 5.38 | | 20 day EMA | 5.35 | 5.34 | 5.34 | | 35 day EMA | 5.32 | 5.31 | 5.31 | | 50 day EMA | 5.27 | 5.26 | 5.26 |
SMA (simple moving average) of Mfs Municipal MFM
| SMA period | SMA current | SMA prev | SMA prev2 | | 5 day SMA | 5.41 | 5.41 | 5.4 | | 12 day SMA | 5.38 | 5.37 | 5.37 | | 20 day SMA | 5.36 | 5.36 | 5.36 | | 35 day SMA | 5.32 | 5.31 | 5.3 | | 50 day SMA | 5.26 | 5.25 | 5.25 | | 100 day SMA | 5.19 | 5.19 | 5.18 | | 150 day SMA | 5.19 | 5.19 | 5.19 | | 200 day SMA | 5.25 | 5.25 | 5.25 |
|
|
