MizuhoFinancial MFG full analysis,charts,indicators,moving averages,SMA,DMA,EMA,ADX,MACD,RSIMizuho Financial MFG WideScreen charts, DMA,SMA,EMA technical analysis, forecast prediction, by indicators ADX,MACD,RSI,CCI NYSE stock exchange
operates under Finance sector & deals in Major Banks
Daily price and charts and targets MizuhoFinancial Strong Daily Stock price targets for MizuhoFinancial MFG are 7.24 and 7.32 | Daily Target 1 | 7.22 | | Daily Target 2 | 7.25 | | Daily Target 3 | 7.3 | | Daily Target 4 | 7.33 | | Daily Target 5 | 7.38 |
Daily price and volume Mizuho Financial
| Date |
Closing |
Open |
Range |
Volume |
Thu 04 December 2025 |
7.28 (0.97%) |
7.34 |
7.27 - 7.35 |
0.5391 times |
Wed 03 December 2025 |
7.21 (-0.69%) |
7.16 |
7.14 - 7.22 |
0.8707 times |
Tue 02 December 2025 |
7.26 (1.4%) |
7.29 |
7.25 - 7.32 |
2.5718 times |
Mon 01 December 2025 |
7.16 (0.85%) |
7.11 |
7.10 - 7.18 |
0.6115 times |
Fri 28 November 2025 |
7.10 (0.14%) |
7.11 |
7.06 - 7.12 |
0.4472 times |
Wed 26 November 2025 |
7.09 (3.35%) |
7.00 |
7.00 - 7.12 |
0.6719 times |
Tue 25 November 2025 |
6.86 (2.39%) |
6.79 |
6.73 - 6.87 |
0.8751 times |
Mon 24 November 2025 |
6.70 (1.36%) |
6.61 |
6.61 - 6.72 |
0.8481 times |
Fri 21 November 2025 |
6.61 (2.48%) |
6.60 |
6.54 - 6.64 |
1.262 times |
Thu 20 November 2025 |
6.45 (-1.83%) |
6.64 |
6.45 - 6.66 |
1.3027 times |
Wed 19 November 2025 |
6.57 (0.31%) |
6.52 |
6.50 - 6.59 |
0.6639 times |
Weekly price and charts MizuhoFinancial Strong weekly Stock price targets for MizuhoFinancial MFG are 7.19 and 7.44 | Weekly Target 1 | 6.99 | | Weekly Target 2 | 7.14 | | Weekly Target 3 | 7.2433333333333 | | Weekly Target 4 | 7.39 | | Weekly Target 5 | 7.49 |
Weekly price and volumes for Mizuho Financial
| Date |
Closing |
Open |
Range |
Volume |
Thu 04 December 2025 |
7.28 (2.54%) |
7.11 |
7.10 - 7.35 |
1.1395 times |
Fri 28 November 2025 |
7.10 (7.41%) |
6.61 |
6.61 - 7.12 |
0.7052 times |
Fri 21 November 2025 |
6.61 (-6.24%) |
6.87 |
6.45 - 6.89 |
1.2516 times |
Fri 14 November 2025 |
7.05 (6.33%) |
6.67 |
6.61 - 7.11 |
1.9569 times |
Fri 07 November 2025 |
6.63 (-1.49%) |
6.75 |
6.53 - 6.75 |
0.7391 times |
Fri 31 October 2025 |
6.73 (0%) |
6.69 |
6.69 - 6.75 |
0.1592 times |
Fri 31 October 2025 |
6.73 (4.18%) |
6.51 |
6.49 - 6.76 |
1.9157 times |
Fri 24 October 2025 |
6.46 (3.69%) |
6.40 |
6.34 - 6.52 |
0.807 times |
Fri 17 October 2025 |
6.23 (-1.89%) |
6.22 |
6.13 - 6.37 |
0.9963 times |
Tue 07 October 2025 |
6.35 (-3.93%) |
6.46 |
6.33 - 6.52 |
0.3296 times |
Fri 03 October 2025 |
6.61 (-3.5%) |
6.78 |
6.43 - 6.78 |
0.8308 times |

Monthly price and charts MizuhoFinancial Strong monthly Stock price targets for MizuhoFinancial MFG are 7.19 and 7.44 | Monthly Target 1 | 6.99 | | Monthly Target 2 | 7.14 | | Monthly Target 3 | 7.2433333333333 | | Monthly Target 4 | 7.39 | | Monthly Target 5 | 7.49 |
Monthly price and volumes Mizuho Financial
| Date |
Closing |
Open |
Range |
Volume |
Thu 04 December 2025 |
7.28 (2.54%) |
7.11 |
7.10 - 7.35 |
0.23 times |
Fri 28 November 2025 |
7.10 (5.5%) |
6.75 |
6.45 - 7.12 |
0.9389 times |
Fri 31 October 2025 |
6.73 (0.45%) |
6.60 |
6.13 - 6.76 |
0.9642 times |
Tue 30 September 2025 |
6.70 (1.52%) |
6.49 |
6.31 - 6.87 |
0.8031 times |
Fri 29 August 2025 |
6.60 (11.86%) |
5.89 |
5.74 - 6.79 |
0.7348 times |
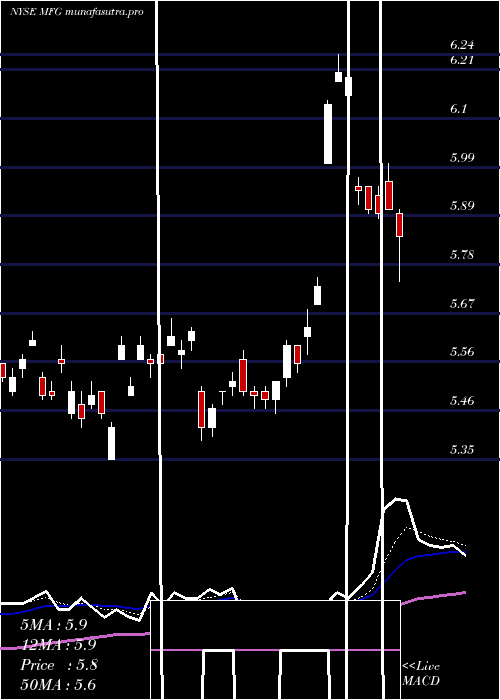
Thu 31 July 2025 |
5.90 (6.12%) |
5.60 |
5.39 - 6.24 |
1.6222 times |
Mon 30 June 2025 |
5.56 (0%) |
5.56 |
5.35 - 5.63 |
0.7566 times |
Fri 30 May 2025 |
5.56 (10.1%) |
4.94 |
4.77 - 5.68 |
1.4117 times |
Wed 30 April 2025 |
5.05 (-8.35%) |
5.45 |
4.04 - 5.46 |
1.9163 times |
Mon 31 March 2025 |
5.51 (-2.3%) |
5.72 |
5.32 - 6.08 |
0.6221 times |
Fri 28 February 2025 |
5.64 (2.92%) |
5.53 |
5.40 - 5.91 |
0.4515 times |

DMA SMA EMA moving averages of Mizuho Financial MFG
DMA (daily moving average) of Mizuho Financial MFG
| DMA period | DMA value | | 5 day DMA | 7.2 | | 12 day DMA | 6.9 | | 20 day DMA | 6.85 | | 35 day DMA | 6.72 | | 50 day DMA | 6.67 | | 100 day DMA | 6.47 | | 150 day DMA | 6.11 | | 200 day DMA | 5.91 | EMA (exponential moving average) of Mizuho Financial MFG
| EMA period | EMA current | EMA prev | EMA prev2 | | 5 day EMA | 7.18 | 7.13 | 7.09 | | 12 day EMA | 7.01 | 6.96 | 6.92 | | 20 day EMA | 6.92 | 6.88 | 6.84 | | 35 day EMA | 6.8 | 6.77 | 6.74 | | 50 day EMA | 6.71 | 6.69 | 6.67 |
SMA (simple moving average) of Mizuho Financial MFG
| SMA period | SMA current | SMA prev | SMA prev2 | | 5 day SMA | 7.2 | 7.16 | 7.09 | | 12 day SMA | 6.9 | 6.86 | 6.85 | | 20 day SMA | 6.85 | 6.82 | 6.79 | | 35 day SMA | 6.72 | 6.69 | 6.66 | | 50 day SMA | 6.67 | 6.66 | 6.65 | | 100 day SMA | 6.47 | 6.46 | 6.44 | | 150 day SMA | 6.11 | 6.09 | 6.08 | | 200 day SMA | 5.91 | 5.9 | 5.89 |
|
|
