MedtronicPlc MDT full analysis,charts,indicators,moving averages,SMA,DMA,EMA,ADX,MACD,RSIMedtronic Plc MDT WideScreen charts, DMA,SMA,EMA technical analysis, forecast prediction, by indicators ADX,MACD,RSI,CCI NYSE stock exchange
operates under Health Care sector & deals in Biotechnology Electromedical Electrotherapeutic Apparatus
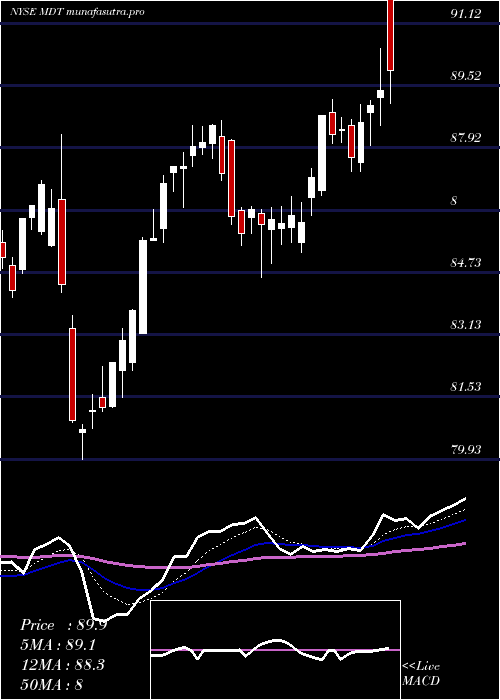
Daily price and charts and targets MedtronicPlc Strong Daily Stock price targets for MedtronicPlc MDT are 100.76 and 101.91 | Daily Target 1 | 100.56 | | Daily Target 2 | 100.96 | | Daily Target 3 | 101.71 | | Daily Target 4 | 102.11 | | Daily Target 5 | 102.86 |
Daily price and volume Medtronic Plc
| Date |
Closing |
Open |
Range |
Volume |
Fri 05 December 2025 |
101.36 (-0.62%) |
102.11 |
101.31 - 102.46 |
0.7483 times |
Thu 04 December 2025 |
101.99 (0.02%) |
102.04 |
101.74 - 102.75 |
0.6501 times |
Wed 03 December 2025 |
101.97 (-0.06%) |
102.54 |
101.58 - 102.91 |
0.6047 times |
Tue 02 December 2025 |
102.03 (-1.27%) |
103.42 |
101.71 - 103.47 |
0.841 times |
Mon 01 December 2025 |
103.34 (-1.89%) |
105.00 |
103.31 - 105.73 |
0.9672 times |
Fri 28 November 2025 |
105.33 (0.3%) |
105.04 |
104.62 - 105.33 |
0.3798 times |
Wed 26 November 2025 |
105.02 (-0.31%) |
105.06 |
104.70 - 106.33 |
0.7616 times |
Tue 25 November 2025 |
105.35 (2.08%) |
103.80 |
103.80 - 105.60 |
1.3758 times |
Mon 24 November 2025 |
103.20 (1.98%) |
101.53 |
100.97 - 103.70 |
2.0204 times |
Fri 21 November 2025 |
101.20 (1.86%) |
99.65 |
99.26 - 102.03 |
1.6511 times |
Thu 20 November 2025 |
99.35 (-0.99%) |
100.37 |
99.08 - 101.19 |
0.9759 times |
Weekly price and charts MedtronicPlc Strong weekly Stock price targets for MedtronicPlc MDT are 99.13 and 103.55 | Weekly Target 1 | 98.38 | | Weekly Target 2 | 99.87 | | Weekly Target 3 | 102.8 | | Weekly Target 4 | 104.29 | | Weekly Target 5 | 107.22 |
Weekly price and volumes for Medtronic Plc
| Date |
Closing |
Open |
Range |
Volume |
Fri 05 December 2025 |
101.36 (-3.77%) |
105.00 |
101.31 - 105.73 |
0.9785 times |
Fri 28 November 2025 |
105.33 (4.08%) |
101.53 |
100.97 - 106.33 |
1.1651 times |
Fri 21 November 2025 |
101.20 (5.56%) |
95.82 |
93.29 - 102.59 |
2.1051 times |
Fri 14 November 2025 |
95.87 (3.98%) |
91.95 |
91.52 - 96.71 |
1.1868 times |
Fri 07 November 2025 |
92.20 (1.65%) |
90.18 |
89.36 - 92.24 |
0.766 times |
Fri 31 October 2025 |
90.70 (0%) |
90.60 |
90.09 - 91.32 |
0.222 times |
Fri 31 October 2025 |
90.70 (-3.17%) |
93.74 |
90.09 - 94.60 |
1.0572 times |
Fri 24 October 2025 |
93.67 (-2.2%) |
96.09 |
91.87 - 97.24 |
1.0224 times |
Fri 17 October 2025 |
95.78 (-2.59%) |
95.70 |
94.06 - 96.86 |
1.0306 times |
Tue 07 October 2025 |
98.33 (0.64%) |
97.08 |
97.08 - 99.37 |
0.4662 times |
Fri 03 October 2025 |
97.70 (3.69%) |
94.21 |
91.87 - 97.94 |
1.3516 times |
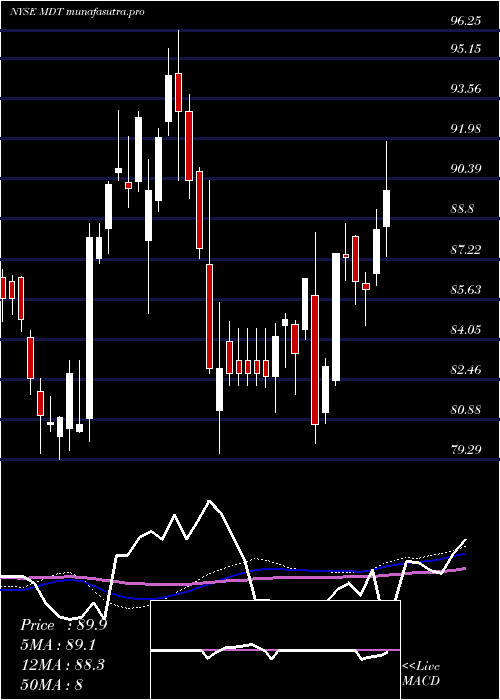
Monthly price and charts MedtronicPlc Strong monthly Stock price targets for MedtronicPlc MDT are 99.13 and 103.55 | Monthly Target 1 | 98.38 | | Monthly Target 2 | 99.87 | | Monthly Target 3 | 102.8 | | Monthly Target 4 | 104.29 | | Monthly Target 5 | 107.22 |
Monthly price and volumes Medtronic Plc
| Date |
Closing |
Open |
Range |
Volume |
Fri 05 December 2025 |
101.36 (-3.77%) |
105.00 |
101.31 - 105.73 |
0.1898 times |
Fri 28 November 2025 |
105.33 (16.13%) |
90.18 |
89.36 - 106.33 |
1.0131 times |
Fri 31 October 2025 |
90.70 (-4.77%) |
95.15 |
90.09 - 99.37 |
0.9081 times |
Tue 30 September 2025 |
95.24 (2.62%) |
92.54 |
91.39 - 95.99 |
1.1108 times |
Fri 29 August 2025 |
92.81 (2.85%) |
89.61 |
87.50 - 94.44 |
1.1027 times |
Thu 31 July 2025 |
90.24 (3.52%) |
86.83 |
86.71 - 93.10 |
1.0939 times |
Mon 30 June 2025 |
87.17 (5.05%) |
82.40 |
82.21 - 88.63 |
1.1595 times |
Fri 30 May 2025 |
82.98 (-2.1%) |
84.20 |
79.93 - 88.28 |
1.2152 times |
Wed 30 April 2025 |
84.76 (-5.68%) |
88.79 |
79.55 - 89.59 |
1.0597 times |
Mon 31 March 2025 |
89.86 (-2.35%) |
92.67 |
86.93 - 96.25 |
1.1471 times |
Fri 28 February 2025 |
92.02 (1.32%) |
90.27 |
85.06 - 93.05 |
0.972 times |
DMA SMA EMA moving averages of Medtronic Plc MDT
DMA (daily moving average) of Medtronic Plc MDT
| DMA period | DMA value | | 5 day DMA | 102.14 | | 12 day DMA | 102.54 | | 20 day DMA | 99.78 | | 35 day DMA | 96.84 | | 50 day DMA | 96.5 | | 100 day DMA | 94.33 | | 150 day DMA | 91.44 | | 200 day DMA | 90.56 | EMA (exponential moving average) of Medtronic Plc MDT
| EMA period | EMA current | EMA prev | EMA prev2 | | 5 day EMA | 102.12 | 102.5 | 102.76 | | 12 day EMA | 101.55 | 101.59 | 101.52 | | 20 day EMA | 100.19 | 100.07 | 99.87 | | 35 day EMA | 98.75 | 98.6 | 98.4 | | 50 day EMA | 96.91 | 96.73 | 96.52 |
SMA (simple moving average) of Medtronic Plc MDT
| SMA period | SMA current | SMA prev | SMA prev2 | | 5 day SMA | 102.14 | 102.93 | 103.54 | | 12 day SMA | 102.54 | 102.5 | 102.02 | | 20 day SMA | 99.78 | 99.22 | 98.64 | | 35 day SMA | 96.84 | 96.66 | 96.47 | | 50 day SMA | 96.5 | 96.36 | 96.23 | | 100 day SMA | 94.33 | 94.22 | 94.09 | | 150 day SMA | 91.44 | 91.32 | 91.2 | | 200 day SMA | 90.56 | 90.52 | 90.47 |
|
|
