MercuryGeneral MCY full analysis,charts,indicators,moving averages,SMA,DMA,EMA,ADX,MACD,RSIMercury General MCY WideScreen charts, DMA,SMA,EMA technical analysis, forecast prediction, by indicators ADX,MACD,RSI,CCI NYSE stock exchange
operates under Finance sector & deals in Property Casualty Insurers
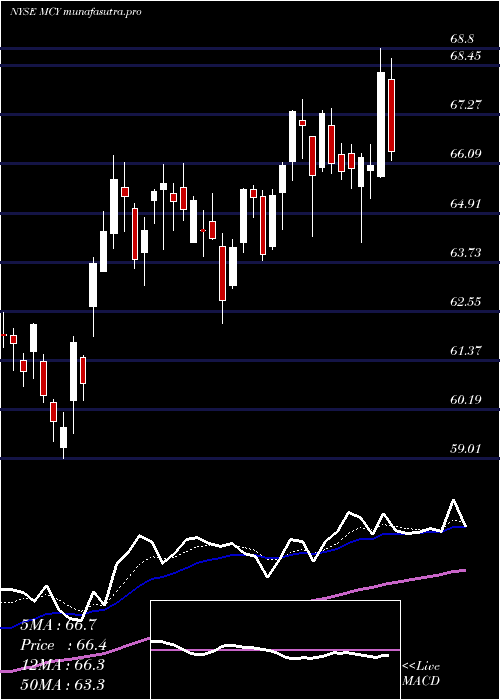
Daily price and charts and targets MercuryGeneral Strong Daily Stock price targets for MercuryGeneral MCY are 78.82 and 80.95 | Daily Target 1 | 77.07 | | Daily Target 2 | 78.43 | | Daily Target 3 | 79.203333333333 | | Daily Target 4 | 80.56 | | Daily Target 5 | 81.33 |
Daily price and volume Mercury General
| Date |
Closing |
Open |
Range |
Volume |
Fri 17 October 2025 |
79.78 (1.45%) |
78.71 |
77.85 - 79.98 |
0.8028 times |
Thu 16 October 2025 |
78.64 (-2.06%) |
79.49 |
77.80 - 79.78 |
1.0349 times |
Wed 15 October 2025 |
80.29 (-1.61%) |
80.67 |
76.77 - 80.67 |
1.7965 times |
Tue 14 October 2025 |
81.60 (2.72%) |
79.42 |
78.54 - 81.78 |
1.134 times |
Mon 13 October 2025 |
79.44 (-7.2%) |
80.61 |
79.39 - 81.35 |
0.8585 times |
Tue 07 October 2025 |
85.60 (-0.73%) |
86.25 |
85.53 - 86.82 |
0.8672 times |
Mon 06 October 2025 |
86.23 (-0.81%) |
87.03 |
86.13 - 87.67 |
0.4346 times |
Fri 03 October 2025 |
86.93 (3.39%) |
84.18 |
84.18 - 87.49 |
1.4904 times |
Thu 02 October 2025 |
84.08 (0.32%) |
83.81 |
81.52 - 84.32 |
0.5289 times |
Wed 01 October 2025 |
83.81 (-1.14%) |
84.46 |
83.80 - 85.96 |
1.0522 times |
Tue 30 September 2025 |
84.78 (2.1%) |
83.56 |
83.30 - 85.02 |
0.747 times |
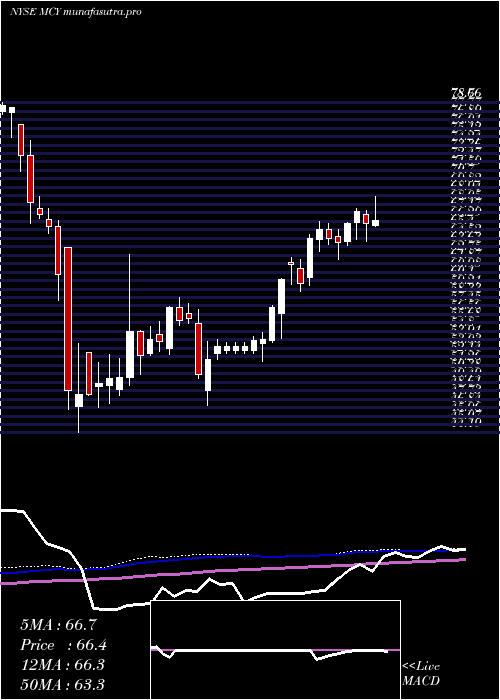
Weekly price and charts MercuryGeneral Strong weekly Stock price targets for MercuryGeneral MCY are 75.77 and 80.78 | Weekly Target 1 | 74.43 | | Weekly Target 2 | 77.11 | | Weekly Target 3 | 79.443333333333 | | Weekly Target 4 | 82.12 | | Weekly Target 5 | 84.45 |
Weekly price and volumes for Mercury General
| Date |
Closing |
Open |
Range |
Volume |
Fri 17 October 2025 |
79.78 (-6.8%) |
80.61 |
76.77 - 81.78 |
1.3123 times |
Tue 07 October 2025 |
85.60 (-1.53%) |
87.03 |
85.53 - 87.67 |
0.3036 times |
Fri 03 October 2025 |
86.93 (4.47%) |
83.27 |
81.52 - 87.49 |
1.1571 times |
Fri 26 September 2025 |
83.21 (4.65%) |
80.21 |
79.94 - 83.22 |
1.4081 times |
Fri 19 September 2025 |
79.51 (0.19%) |
79.41 |
76.34 - 79.65 |
1.3453 times |
Fri 12 September 2025 |
79.36 (2.49%) |
77.65 |
76.01 - 79.66 |
1.082 times |
Fri 05 September 2025 |
77.43 (0.13%) |
76.54 |
76.00 - 78.96 |
0.7398 times |
Fri 29 August 2025 |
77.33 (0%) |
77.73 |
76.76 - 78.28 |
0.1845 times |
Fri 29 August 2025 |
77.33 (1.16%) |
76.49 |
75.96 - 79.00 |
1.3054 times |
Fri 22 August 2025 |
76.44 (3%) |
74.07 |
73.05 - 77.70 |
1.1619 times |
Fri 15 August 2025 |
74.21 (4.77%) |
70.70 |
70.52 - 75.78 |
1.3474 times |
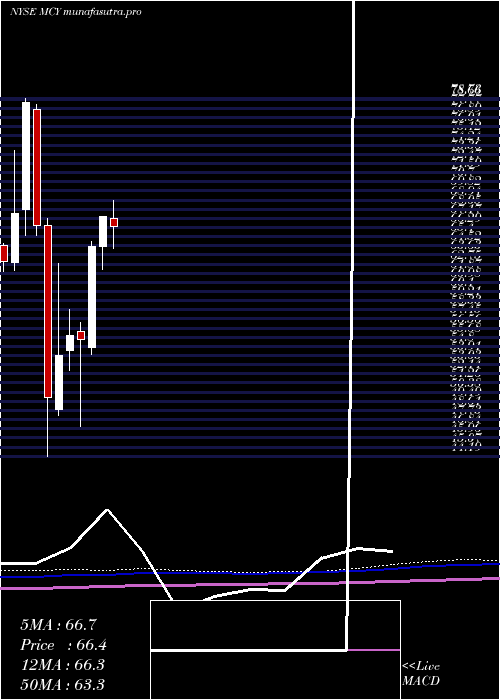
Monthly price and charts MercuryGeneral Strong monthly Stock price targets for MercuryGeneral MCY are 72.83 and 83.73 | Monthly Target 1 | 70.51 | | Monthly Target 2 | 75.14 | | Monthly Target 3 | 81.406666666667 | | Monthly Target 4 | 86.04 | | Monthly Target 5 | 92.31 |
Monthly price and volumes Mercury General
| Date |
Closing |
Open |
Range |
Volume |
Fri 17 October 2025 |
79.78 (-5.9%) |
84.46 |
76.77 - 87.67 |
0.2439 times |
Tue 30 September 2025 |
84.78 (9.63%) |
76.54 |
76.00 - 85.02 |
0.5246 times |
Fri 29 August 2025 |
77.33 (11.67%) |
69.40 |
66.57 - 79.00 |
0.5847 times |
Thu 31 July 2025 |
69.25 (2.84%) |
67.14 |
64.21 - 74.28 |
0.7035 times |
Mon 30 June 2025 |
67.34 (4.44%) |
64.41 |
62.25 - 67.36 |
0.6328 times |
Fri 30 May 2025 |
64.48 (16.35%) |
54.67 |
54.00 - 64.95 |
0.8246 times |
Wed 30 April 2025 |
55.42 (-0.86%) |
56.27 |
47.06 - 57.12 |
0.7697 times |
Mon 31 March 2025 |
55.90 (3.65%) |
54.44 |
52.43 - 58.34 |
1.0714 times |
Fri 28 February 2025 |
53.93 (8.21%) |
48.75 |
48.13 - 62.84 |
1.8466 times |
Fri 31 January 2025 |
49.84 (-25.03%) |
66.48 |
44.19 - 67.17 |
2.7982 times |
Tue 31 December 2024 |
66.48 (-15.18%) |
77.65 |
65.52 - 78.14 |
0.5251 times |
DMA SMA EMA moving averages of Mercury General MCY
DMA (daily moving average) of Mercury General MCY
| DMA period | DMA value | | 5 day DMA | 79.95 | | 12 day DMA | 82.85 | | 20 day DMA | 82.06 | | 35 day DMA | 80.26 | | 50 day DMA | 78.4 | | 100 day DMA | 72.2 | | 150 day DMA | 66.75 | | 200 day DMA | 63.5 | EMA (exponential moving average) of Mercury General MCY
| EMA period | EMA current | EMA prev | EMA prev2 | | 5 day EMA | 80.49 | 80.85 | 81.95 | | 12 day EMA | 81.56 | 81.88 | 82.47 | | 20 day EMA | 81.31 | 81.47 | 81.77 | | 35 day EMA | 79.87 | 79.88 | 79.95 | | 50 day EMA | 77.86 | 77.78 | 77.75 |
SMA (simple moving average) of Mercury General MCY
| SMA period | SMA current | SMA prev | SMA prev2 | | 5 day SMA | 79.95 | 81.11 | 82.63 | | 12 day SMA | 82.85 | 83.14 | 83.4 | | 20 day SMA | 82.06 | 81.95 | 81.94 | | 35 day SMA | 80.26 | 80.21 | 80.14 | | 50 day SMA | 78.4 | 78.25 | 78.03 | | 100 day SMA | 72.2 | 72.03 | 71.85 | | 150 day SMA | 66.75 | 66.58 | 66.41 | | 200 day SMA | 63.5 | 63.43 | 63.38 |
|
|
