McdonaldS MCD full analysis,charts,indicators,moving averages,SMA,DMA,EMA,ADX,MACD,RSIMcdonald S MCD WideScreen charts, DMA,SMA,EMA technical analysis, forecast prediction, by indicators ADX,MACD,RSI,CCI NYSE stock exchange
operates under Consumer Services sector & deals in Restaurants
Daily price and charts and targets McdonaldS Strong Daily Stock price targets for McdonaldS MCD are 305.38 and 308.24 | Daily Target 1 | 304.58 | | Daily Target 2 | 306.17 | | Daily Target 3 | 307.43666666667 | | Daily Target 4 | 309.03 | | Daily Target 5 | 310.3 |
Daily price and volume Mcdonald S
| Date |
Closing |
Open |
Range |
Volume |
Mon 20 October 2025 |
307.77 (-0.1%) |
307.95 |
305.84 - 308.70 |
0.9924 times |
Fri 17 October 2025 |
308.09 (0.9%) |
306.80 |
306.31 - 308.33 |
0.9346 times |
Thu 16 October 2025 |
305.33 (0.03%) |
305.79 |
304.72 - 307.28 |
0.861 times |
Wed 15 October 2025 |
305.25 (0.23%) |
303.63 |
303.63 - 309.10 |
1.0744 times |
Tue 14 October 2025 |
304.56 (1.48%) |
300.16 |
300.11 - 305.52 |
1.2749 times |
Mon 13 October 2025 |
300.11 (1.28%) |
294.60 |
294.00 - 300.42 |
1.4354 times |
Tue 07 October 2025 |
296.32 (-0.05%) |
295.00 |
294.13 - 298.07 |
1.0718 times |
Mon 06 October 2025 |
296.46 (-1.48%) |
300.41 |
294.91 - 300.50 |
0.9457 times |
Fri 03 October 2025 |
300.90 (0.25%) |
300.50 |
298.66 - 301.39 |
0.6995 times |
Thu 02 October 2025 |
300.15 (-0.12%) |
300.99 |
298.95 - 302.38 |
0.7101 times |
Wed 01 October 2025 |
300.52 (-1.11%) |
303.26 |
298.30 - 304.77 |
1.3012 times |
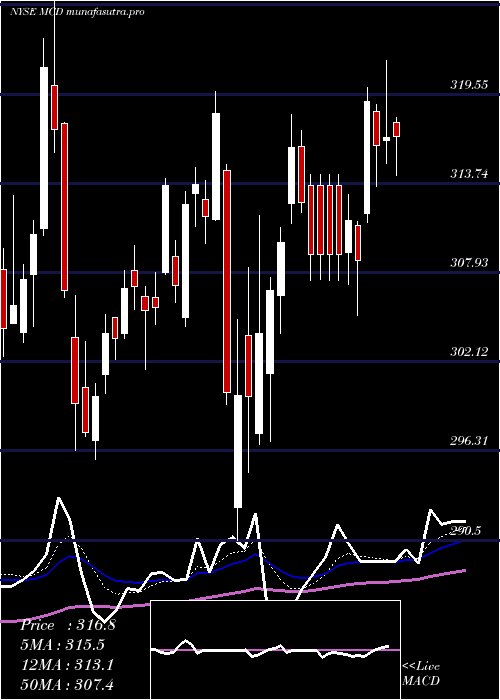
Weekly price and charts McdonaldS Strong weekly Stock price targets for McdonaldS MCD are 305.38 and 308.24 | Weekly Target 1 | 304.58 | | Weekly Target 2 | 306.17 | | Weekly Target 3 | 307.43666666667 | | Weekly Target 4 | 309.03 | | Weekly Target 5 | 310.3 |
Weekly price and volumes for Mcdonald S
| Date |
Closing |
Open |
Range |
Volume |
Mon 20 October 2025 |
307.77 (-0.1%) |
307.95 |
305.84 - 308.70 |
0.2134 times |
Fri 17 October 2025 |
308.09 (3.97%) |
294.60 |
294.00 - 309.10 |
1.2002 times |
Tue 07 October 2025 |
296.32 (-1.52%) |
300.41 |
294.13 - 300.50 |
0.4339 times |
Fri 03 October 2025 |
300.90 (-1.42%) |
305.88 |
298.30 - 306.11 |
1.1065 times |
Fri 26 September 2025 |
305.24 (0.95%) |
302.32 |
300.32 - 306.33 |
1.274 times |
Fri 19 September 2025 |
302.38 (-0.99%) |
305.14 |
297.88 - 306.58 |
1.8502 times |
Fri 12 September 2025 |
305.40 (-2.86%) |
312.82 |
304.61 - 313.70 |
1.2367 times |
Fri 05 September 2025 |
314.38 (0.27%) |
313.05 |
312.33 - 319.43 |
1.0869 times |
Fri 29 August 2025 |
313.54 (0%) |
312.23 |
311.43 - 313.90 |
0.2284 times |
Fri 29 August 2025 |
313.54 (-0.17%) |
313.73 |
309.35 - 315.72 |
1.3697 times |
Fri 22 August 2025 |
314.07 (1.66%) |
308.37 |
306.56 - 316.80 |
1.3858 times |
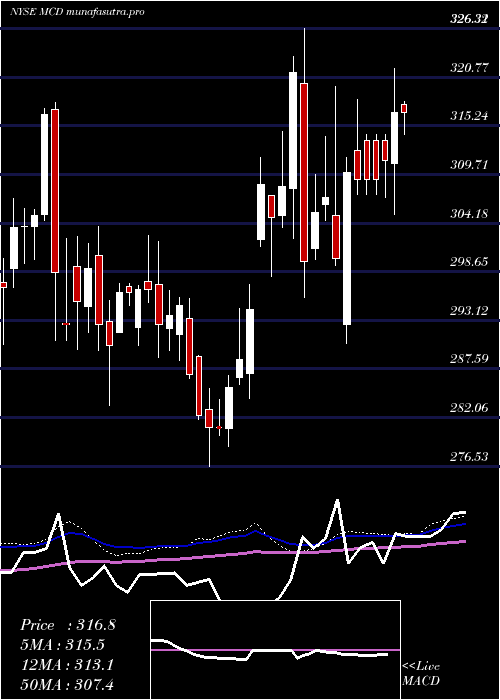
Monthly price and charts McdonaldS Strong monthly Stock price targets for McdonaldS MCD are 300.89 and 315.99 | Monthly Target 1 | 288.52 | | Monthly Target 2 | 298.15 | | Monthly Target 3 | 303.62333333333 | | Monthly Target 4 | 313.25 | | Monthly Target 5 | 318.72 |
Monthly price and volumes Mcdonald S
| Date |
Closing |
Open |
Range |
Volume |
Mon 20 October 2025 |
307.77 (1.28%) |
303.26 |
294.00 - 309.10 |
0.397 times |
Tue 30 September 2025 |
303.89 (-3.08%) |
313.05 |
297.88 - 319.43 |
0.9753 times |
Fri 29 August 2025 |
313.54 (4.49%) |
303.50 |
298.37 - 316.80 |
1.0481 times |
Thu 31 July 2025 |
300.07 (2.7%) |
292.50 |
290.26 - 305.43 |
1.1552 times |
Mon 30 June 2025 |
292.17 (-6.91%) |
310.73 |
283.47 - 314.39 |
1.1543 times |
Fri 30 May 2025 |
313.85 (-1.81%) |
313.15 |
305.01 - 321.72 |
0.9104 times |
Wed 30 April 2025 |
319.65 (2.33%) |
313.08 |
290.50 - 321.78 |
1.2646 times |
Mon 31 March 2025 |
312.37 (1.31%) |
308.11 |
295.71 - 326.32 |
1.0817 times |
Fri 28 February 2025 |
308.33 (6.8%) |
287.02 |
284.19 - 314.55 |
1.0194 times |
Fri 31 January 2025 |
288.70 (-0.41%) |
290.95 |
276.53 - 295.76 |
0.994 times |
Tue 31 December 2024 |
289.89 (-2.17%) |
292.32 |
288.58 - 302.82 |
0.7028 times |

DMA SMA EMA moving averages of Mcdonald S MCD
DMA (daily moving average) of Mcdonald S MCD
| DMA period | DMA value | | 5 day DMA | 306.2 | | 12 day DMA | 302.45 | | 20 day DMA | 302.7 | | 35 day DMA | 306.06 | | 50 day DMA | 307.05 | | 100 day DMA | 303.66 | | 150 day DMA | 306.02 | | 200 day DMA | 303.57 | EMA (exponential moving average) of Mcdonald S MCD
| EMA period | EMA current | EMA prev | EMA prev2 | | 5 day EMA | 305.88 | 304.94 | 303.36 | | 12 day EMA | 304.07 | 303.4 | 302.55 | | 20 day EMA | 304.04 | 303.65 | 303.18 | | 35 day EMA | 304.91 | 304.74 | 304.54 | | 50 day EMA | 306.62 | 306.57 | 306.51 |
SMA (simple moving average) of Mcdonald S MCD
| SMA period | SMA current | SMA prev | SMA prev2 | | 5 day SMA | 306.2 | 304.67 | 302.31 | | 12 day SMA | 302.45 | 302.05 | 301.81 | | 20 day SMA | 302.7 | 302.56 | 302.32 | | 35 day SMA | 306.06 | 306.17 | 306.3 | | 50 day SMA | 307.05 | 307.04 | 306.86 | | 100 day SMA | 303.66 | 303.75 | 303.87 | | 150 day SMA | 306.02 | 306.01 | 306.07 | | 200 day SMA | 303.57 | 303.5 | 303.43 |
|
|
