MoelisCompany MC full analysis,charts,indicators,moving averages,SMA,DMA,EMA,ADX,MACD,RSIMoelis Company MC WideScreen charts, DMA,SMA,EMA technical analysis, forecast prediction, by indicators ADX,MACD,RSI,CCI NYSE stock exchange
operates under Finance sector & deals in Investment Managers
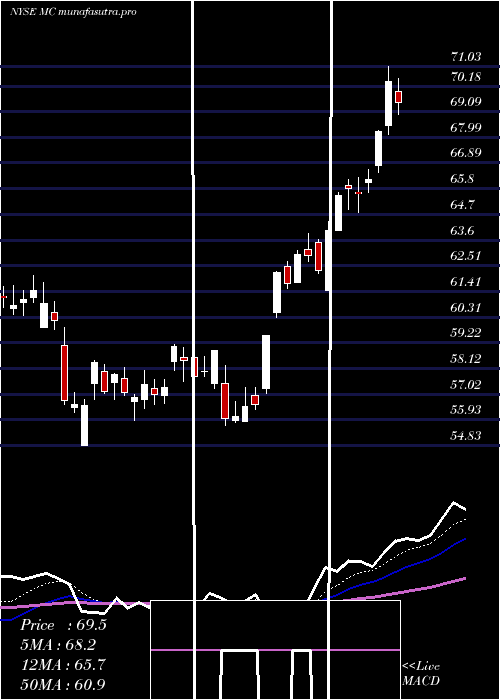
Daily price and charts and targets MoelisCompany Strong Daily Stock price targets for MoelisCompany MC are 68.56 and 69.95 | Daily Target 1 | 67.47 | | Daily Target 2 | 68.25 | | Daily Target 3 | 68.863333333333 | | Daily Target 4 | 69.64 | | Daily Target 5 | 70.25 |
Daily price and volume Moelis Company
| Date |
Closing |
Open |
Range |
Volume |
Tue 21 October 2025 |
69.02 (0.54%) |
68.65 |
68.09 - 69.48 |
1.108 times |
Mon 20 October 2025 |
68.65 (1.4%) |
68.41 |
68.27 - 69.49 |
0.6964 times |
Fri 17 October 2025 |
67.70 (0.88%) |
67.34 |
65.97 - 67.89 |
0.8995 times |
Thu 16 October 2025 |
67.11 (-2.14%) |
68.31 |
66.54 - 68.57 |
0.9262 times |
Wed 15 October 2025 |
68.58 (1.31%) |
68.85 |
67.86 - 69.15 |
1.1866 times |
Tue 14 October 2025 |
67.69 (2.92%) |
64.96 |
64.80 - 67.91 |
1.0923 times |
Mon 13 October 2025 |
65.77 (-1.54%) |
64.08 |
63.89 - 66.05 |
1.3754 times |
Tue 07 October 2025 |
66.80 (-1.1%) |
67.52 |
66.57 - 68.15 |
0.9194 times |
Mon 06 October 2025 |
67.54 (-1.07%) |
70.66 |
66.92 - 70.66 |
0.724 times |
Fri 03 October 2025 |
68.27 (-0.81%) |
69.50 |
67.82 - 70.09 |
1.0723 times |
Thu 02 October 2025 |
68.83 (0.19%) |
68.90 |
67.46 - 69.26 |
0.6465 times |
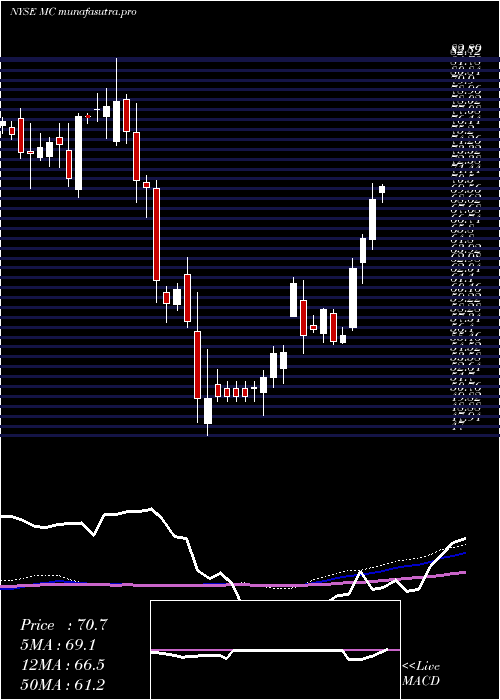
Weekly price and charts MoelisCompany Strong weekly Stock price targets for MoelisCompany MC are 68.56 and 69.96 | Weekly Target 1 | 67.47 | | Weekly Target 2 | 68.24 | | Weekly Target 3 | 68.866666666667 | | Weekly Target 4 | 69.64 | | Weekly Target 5 | 70.27 |
Weekly price and volumes for Moelis Company
| Date |
Closing |
Open |
Range |
Volume |
Tue 21 October 2025 |
69.02 (1.95%) |
68.41 |
68.09 - 69.49 |
0.4798 times |
Fri 17 October 2025 |
67.70 (1.35%) |
64.08 |
63.89 - 69.15 |
1.4572 times |
Tue 07 October 2025 |
66.80 (-2.15%) |
70.66 |
66.57 - 70.66 |
0.437 times |
Fri 03 October 2025 |
68.27 (-5.7%) |
73.24 |
67.46 - 73.70 |
1.364 times |
Fri 26 September 2025 |
72.40 (-6.19%) |
76.91 |
71.38 - 77.59 |
1.3661 times |
Fri 19 September 2025 |
77.18 (3.33%) |
75.05 |
73.54 - 78.05 |
1.7045 times |
Fri 12 September 2025 |
74.69 (5.67%) |
71.68 |
70.51 - 75.89 |
0.9225 times |
Fri 05 September 2025 |
70.68 (-1.98%) |
70.74 |
68.93 - 72.63 |
0.8707 times |
Fri 29 August 2025 |
72.11 (0%) |
72.85 |
71.47 - 72.97 |
0.2508 times |
Fri 29 August 2025 |
72.11 (-0.61%) |
72.40 |
71.47 - 73.86 |
1.1472 times |
Fri 22 August 2025 |
72.55 (0.65%) |
72.06 |
69.01 - 73.25 |
1.3041 times |
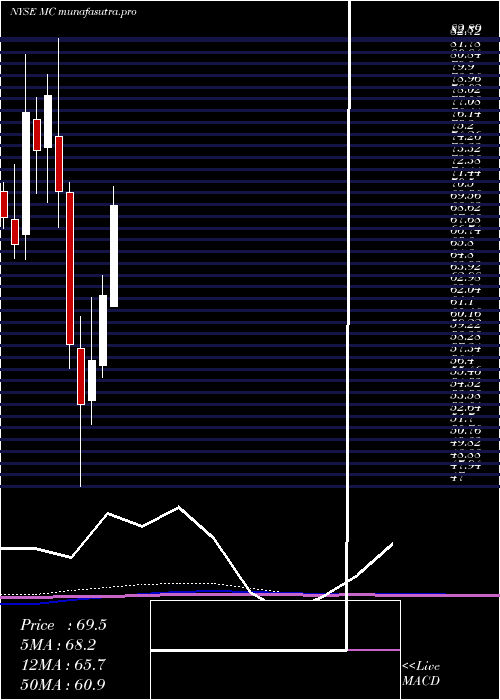
Monthly price and charts MoelisCompany Strong monthly Stock price targets for MoelisCompany MC are 62.6 and 70.31 | Monthly Target 1 | 60.46 | | Monthly Target 2 | 64.74 | | Monthly Target 3 | 68.17 | | Monthly Target 4 | 72.45 | | Monthly Target 5 | 75.88 |
Monthly price and volumes Moelis Company
| Date |
Closing |
Open |
Range |
Volume |
Tue 21 October 2025 |
69.02 (-3.22%) |
70.52 |
63.89 - 71.60 |
0.4613 times |
Tue 30 September 2025 |
71.32 (-1.1%) |
70.74 |
68.93 - 78.05 |
0.7844 times |
Fri 29 August 2025 |
72.11 (2.81%) |
68.17 |
66.36 - 75.10 |
0.812 times |
Thu 31 July 2025 |
70.14 (12.55%) |
61.45 |
61.45 - 73.99 |
1.1434 times |
Mon 30 June 2025 |
62.32 (9.12%) |
56.73 |
55.70 - 63.90 |
1.0308 times |
Fri 30 May 2025 |
57.11 (6.59%) |
53.92 |
51.98 - 62.10 |
1.086 times |
Wed 30 April 2025 |
53.58 (-8.19%) |
58.03 |
47.00 - 60.62 |
1.2917 times |
Mon 31 March 2025 |
58.36 (-17.38%) |
70.55 |
56.48 - 71.30 |
1.4187 times |
Fri 28 February 2025 |
70.64 (-9.77%) |
75.00 |
67.75 - 82.89 |
1.0526 times |
Fri 31 January 2025 |
78.29 (5.97%) |
74.18 |
69.70 - 80.00 |
0.919 times |
Tue 31 December 2024 |
73.88 (-3.93%) |
76.37 |
70.49 - 78.15 |
0.5405 times |
DMA SMA EMA moving averages of Moelis Company MC
DMA (daily moving average) of Moelis Company MC
| DMA period | DMA value | | 5 day DMA | 68.21 | | 12 day DMA | 67.89 | | 20 day DMA | 70.16 | | 35 day DMA | 71.47 | | 50 day DMA | 71.68 | | 100 day DMA | 67.91 | | 150 day DMA | 63.75 | | 200 day DMA | 66.1 | EMA (exponential moving average) of Moelis Company MC
| EMA period | EMA current | EMA prev | EMA prev2 | | 5 day EMA | 68.33 | 67.98 | 67.65 | | 12 day EMA | 68.72 | 68.66 | 68.66 | | 20 day EMA | 69.54 | 69.6 | 69.7 | | 35 day EMA | 70.29 | 70.37 | 70.47 | | 50 day EMA | 71.17 | 71.26 | 71.37 |
SMA (simple moving average) of Moelis Company MC
| SMA period | SMA current | SMA prev | SMA prev2 | | 5 day SMA | 68.21 | 67.95 | 67.37 | | 12 day SMA | 67.89 | 68.08 | 68.38 | | 20 day SMA | 70.16 | 70.6 | 70.94 | | 35 day SMA | 71.47 | 71.58 | 71.69 | | 50 day SMA | 71.68 | 71.69 | 71.72 | | 100 day SMA | 67.91 | 67.79 | 67.67 | | 150 day SMA | 63.75 | 63.68 | 63.62 | | 200 day SMA | 66.1 | 66.12 | 66.15 |
|
|
