MascoCorporation MAS full analysis,charts,indicators,moving averages,SMA,DMA,EMA,ADX,MACD,RSIMasco Corporation MAS WideScreen charts, DMA,SMA,EMA technical analysis, forecast prediction, by indicators ADX,MACD,RSI,CCI NYSE stock exchange
operates under Basic Industries sector & deals in Forest Products
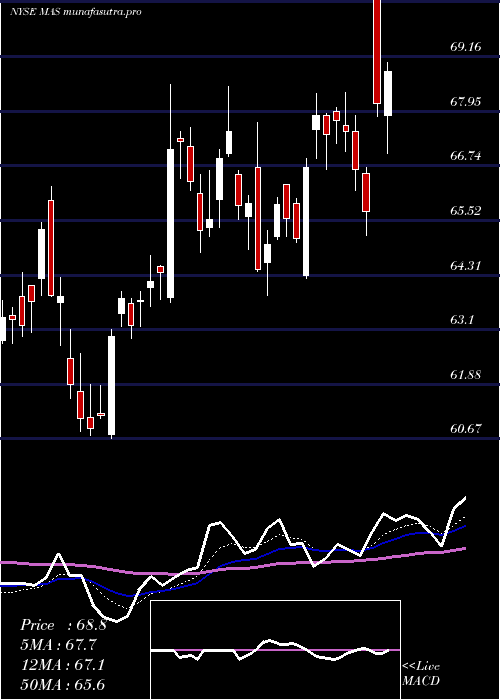
Daily price and charts and targets MascoCorporation Strong Daily Stock price targets for MascoCorporation MAS are 61.71 and 64.14 | Daily Target 1 | 61.21 | | Daily Target 2 | 62.2 | | Daily Target 3 | 63.636666666667 | | Daily Target 4 | 64.63 | | Daily Target 5 | 66.07 |
Daily price and volume Masco Corporation
| Date |
Closing |
Open |
Range |
Volume |
Fri 05 December 2025 |
63.20 (-1.86%) |
63.70 |
62.64 - 65.07 |
1.5567 times |
Thu 04 December 2025 |
64.40 (-0.34%) |
64.73 |
64.22 - 65.44 |
1.009 times |
Wed 03 December 2025 |
64.62 (0.54%) |
64.39 |
64.13 - 65.38 |
0.5973 times |
Tue 02 December 2025 |
64.27 (-0.77%) |
64.72 |
63.67 - 64.74 |
0.9642 times |
Mon 01 December 2025 |
64.77 (-0.15%) |
63.99 |
63.51 - 65.43 |
0.6801 times |
Fri 28 November 2025 |
64.87 (0.7%) |
64.75 |
64.16 - 65.06 |
0.3016 times |
Wed 26 November 2025 |
64.42 (1.71%) |
62.97 |
62.88 - 64.89 |
1.0472 times |
Tue 25 November 2025 |
63.34 (2.59%) |
62.49 |
61.95 - 63.71 |
1.5116 times |
Mon 24 November 2025 |
61.74 (-0.8%) |
62.04 |
61.71 - 62.67 |
1.2037 times |
Fri 21 November 2025 |
62.24 (3.56%) |
60.59 |
60.40 - 63.29 |
1.1287 times |
Thu 20 November 2025 |
60.10 (1.11%) |
59.95 |
59.60 - 60.62 |
1.0243 times |
Weekly price and charts MascoCorporation Strong weekly Stock price targets for MascoCorporation MAS are 61.52 and 64.32 | Weekly Target 1 | 60.96 | | Weekly Target 2 | 62.08 | | Weekly Target 3 | 63.76 | | Weekly Target 4 | 64.88 | | Weekly Target 5 | 66.56 |
Weekly price and volumes for Masco Corporation
| Date |
Closing |
Open |
Range |
Volume |
Fri 05 December 2025 |
63.20 (-2.57%) |
63.99 |
62.64 - 65.44 |
1.3246 times |
Fri 28 November 2025 |
64.87 (4.23%) |
62.04 |
61.71 - 65.06 |
1.1198 times |
Fri 21 November 2025 |
62.24 (2.45%) |
60.67 |
58.29 - 63.29 |
1.3584 times |
Fri 14 November 2025 |
60.75 (-2%) |
62.08 |
60.64 - 63.05 |
0.9919 times |
Fri 07 November 2025 |
61.99 (-4.28%) |
62.82 |
61.40 - 64.48 |
1.3191 times |
Fri 31 October 2025 |
64.76 (0%) |
64.56 |
64.31 - 65.18 |
0.2541 times |
Fri 31 October 2025 |
64.76 (-4.96%) |
68.25 |
63.98 - 69.31 |
1.6285 times |
Fri 24 October 2025 |
68.14 (0.4%) |
68.16 |
67.88 - 70.51 |
0.7846 times |
Fri 17 October 2025 |
67.87 (-0.96%) |
65.97 |
65.41 - 68.92 |
0.9188 times |
Tue 07 October 2025 |
68.53 (-2.63%) |
70.52 |
68.34 - 70.73 |
0.3002 times |
Fri 03 October 2025 |
70.38 (-0.09%) |
71.01 |
69.18 - 71.66 |
0.8457 times |

Monthly price and charts MascoCorporation Strong monthly Stock price targets for MascoCorporation MAS are 61.52 and 64.32 | Monthly Target 1 | 60.96 | | Monthly Target 2 | 62.08 | | Monthly Target 3 | 63.76 | | Monthly Target 4 | 64.88 | | Monthly Target 5 | 66.56 |
Monthly price and volumes Masco Corporation
| Date |
Closing |
Open |
Range |
Volume |
Fri 05 December 2025 |
63.20 (-2.57%) |
63.99 |
62.64 - 65.44 |
0.3052 times |
Fri 28 November 2025 |
64.87 (0.17%) |
62.82 |
58.29 - 65.06 |
1.1034 times |
Fri 31 October 2025 |
64.76 (-8%) |
69.84 |
63.98 - 71.66 |
0.995 times |
Tue 30 September 2025 |
70.39 (-4.09%) |
72.16 |
69.18 - 76.28 |
1.1458 times |
Fri 29 August 2025 |
73.39 (7.72%) |
67.85 |
67.00 - 76.40 |
1.0507 times |
Thu 31 July 2025 |
68.13 (5.86%) |
63.80 |
63.69 - 72.69 |
1.1538 times |
Mon 30 June 2025 |
64.36 (3.11%) |
61.78 |
60.13 - 66.28 |
0.9784 times |
Fri 30 May 2025 |
62.42 (2.99%) |
60.57 |
59.96 - 69.92 |
1.0843 times |
Wed 30 April 2025 |
60.61 (-12.84%) |
69.59 |
57.27 - 71.23 |
1.2129 times |
Mon 31 March 2025 |
69.54 (-7.5%) |
75.63 |
67.84 - 76.36 |
0.9704 times |
Fri 28 February 2025 |
75.18 (-5.17%) |
77.61 |
73.99 - 79.16 |
0.7047 times |

DMA SMA EMA moving averages of Masco Corporation MAS
DMA (daily moving average) of Masco Corporation MAS
| DMA period | DMA value | | 5 day DMA | 64.25 | | 12 day DMA | 63.12 | | 20 day DMA | 62.32 | | 35 day DMA | 64.13 | | 50 day DMA | 65.75 | | 100 day DMA | 68.39 | | 150 day DMA | 66.87 | | 200 day DMA | 67.19 | EMA (exponential moving average) of Masco Corporation MAS
| EMA period | EMA current | EMA prev | EMA prev2 | | 5 day EMA | 63.91 | 64.27 | 64.21 | | 12 day EMA | 63.48 | 63.53 | 63.37 | | 20 day EMA | 63.5 | 63.53 | 63.44 | | 35 day EMA | 64.61 | 64.69 | 64.71 | | 50 day EMA | 66.14 | 66.26 | 66.34 |
SMA (simple moving average) of Masco Corporation MAS
| SMA period | SMA current | SMA prev | SMA prev2 | | 5 day SMA | 64.25 | 64.59 | 64.59 | | 12 day SMA | 63.12 | 62.78 | 62.36 | | 20 day SMA | 62.32 | 62.26 | 62.21 | | 35 day SMA | 64.13 | 64.27 | 64.36 | | 50 day SMA | 65.75 | 65.91 | 66.06 | | 100 day SMA | 68.39 | 68.42 | 68.45 | | 150 day SMA | 66.87 | 66.85 | 66.82 | | 200 day SMA | 67.19 | 67.26 | 67.33 |
|
|
