ManchesterUnited MANU full analysis,charts,indicators,moving averages,SMA,DMA,EMA,ADX,MACD,RSIManchester United MANU WideScreen charts, DMA,SMA,EMA technical analysis, forecast prediction, by indicators ADX,MACD,RSI,CCI NYSE stock exchange
operates under Consumer Services sector & deals in Services Misc Amusement Recreation
Daily price and charts and targets ManchesterUnited Strong Daily Stock price targets for ManchesterUnited MANU are 15.48 and 15.75 | Daily Target 1 | 15.4 | | Daily Target 2 | 15.55 | | Daily Target 3 | 15.673333333333 | | Daily Target 4 | 15.82 | | Daily Target 5 | 15.94 |
Daily price and volume Manchester United
| Date |
Closing |
Open |
Range |
Volume |
Thu 04 December 2025 |
15.69 (-1.38%) |
15.76 |
15.53 - 15.80 |
0.4443 times |
Wed 03 December 2025 |
15.91 (2.45%) |
15.49 |
15.36 - 15.96 |
0.921 times |
Tue 02 December 2025 |
15.53 (-1.65%) |
15.77 |
15.31 - 15.84 |
2.6428 times |
Mon 01 December 2025 |
15.79 (-0.69%) |
15.73 |
15.67 - 16.11 |
0.9455 times |
Fri 28 November 2025 |
15.90 (1.79%) |
15.68 |
15.63 - 16.12 |
0.6028 times |
Wed 26 November 2025 |
15.62 (0.84%) |
15.47 |
15.31 - 15.80 |
0.9649 times |
Tue 25 November 2025 |
15.49 (1.44%) |
15.45 |
15.44 - 15.98 |
1.054 times |
Mon 24 November 2025 |
15.27 (-1.1%) |
15.36 |
15.18 - 15.38 |
0.9414 times |
Fri 21 November 2025 |
15.44 (0.72%) |
15.35 |
15.11 - 15.55 |
0.7383 times |
Thu 20 November 2025 |
15.33 (-1.03%) |
15.59 |
15.30 - 15.59 |
0.7449 times |
Wed 19 November 2025 |
15.49 (0.13%) |
15.50 |
15.26 - 15.54 |
0.6452 times |
Weekly price and charts ManchesterUnited Strong weekly Stock price targets for ManchesterUnited MANU are 15.1 and 15.9 | Weekly Target 1 | 14.9 | | Weekly Target 2 | 15.3 | | Weekly Target 3 | 15.703333333333 | | Weekly Target 4 | 16.1 | | Weekly Target 5 | 16.5 |
Weekly price and volumes for Manchester United
| Date |
Closing |
Open |
Range |
Volume |
Thu 04 December 2025 |
15.69 (-1.32%) |
15.73 |
15.31 - 16.11 |
1.2426 times |
Fri 28 November 2025 |
15.90 (2.98%) |
15.36 |
15.18 - 16.12 |
0.8938 times |
Fri 21 November 2025 |
15.44 (-1.47%) |
15.61 |
15.11 - 15.63 |
0.9372 times |
Fri 14 November 2025 |
15.67 (0.13%) |
15.83 |
15.40 - 16.11 |
1.0385 times |
Fri 07 November 2025 |
15.65 (-5.89%) |
15.95 |
15.37 - 16.01 |
0.5689 times |
Fri 31 October 2025 |
16.63 (0%) |
17.32 |
16.60 - 17.35 |
0.3454 times |
Fri 31 October 2025 |
16.63 (-8.63%) |
18.43 |
16.60 - 18.47 |
0.9451 times |
Fri 24 October 2025 |
18.20 (1.56%) |
18.04 |
17.80 - 18.94 |
1.6244 times |
Fri 17 October 2025 |
17.92 (17.82%) |
16.21 |
16.03 - 18.34 |
2.1275 times |
Tue 07 October 2025 |
15.21 (-0.78%) |
15.34 |
15.12 - 15.50 |
0.2765 times |
Fri 03 October 2025 |
15.33 (-0.52%) |
15.49 |
15.06 - 15.64 |
0.7532 times |
Monthly price and charts ManchesterUnited Strong monthly Stock price targets for ManchesterUnited MANU are 15.1 and 15.9 | Monthly Target 1 | 14.9 | | Monthly Target 2 | 15.3 | | Monthly Target 3 | 15.703333333333 | | Monthly Target 4 | 16.1 | | Monthly Target 5 | 16.5 |
Monthly price and volumes Manchester United
| Date |
Closing |
Open |
Range |
Volume |
Thu 04 December 2025 |
15.69 (-1.32%) |
15.73 |
15.31 - 16.11 |
0.333 times |
Fri 28 November 2025 |
15.90 (-4.39%) |
15.95 |
15.11 - 16.12 |
0.9215 times |
Fri 31 October 2025 |
16.63 (9.84%) |
15.10 |
15.06 - 18.94 |
1.514 times |
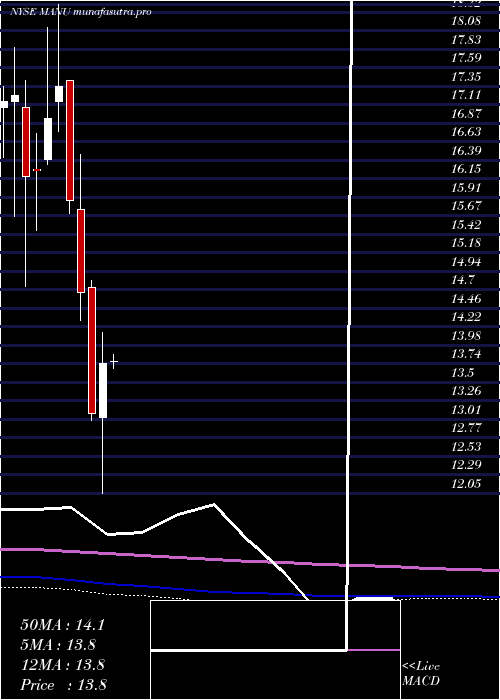
Tue 30 September 2025 |
15.14 (-15.18%) |
17.79 |
14.59 - 17.80 |
1.5644 times |
Fri 29 August 2025 |
17.85 (1.48%) |
17.41 |
17.00 - 18.05 |
0.6304 times |
Thu 31 July 2025 |
17.59 (-1.24%) |
17.62 |
16.67 - 18.18 |
0.8614 times |
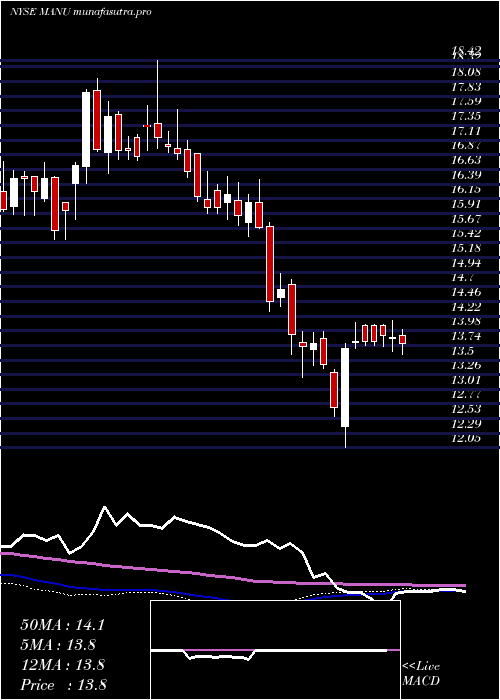
Mon 30 June 2025 |
17.81 (25.69%) |
14.22 |
13.80 - 19.65 |
1.4283 times |
Fri 30 May 2025 |
14.17 (3.13%) |
13.77 |
13.22 - 14.87 |
0.8914 times |
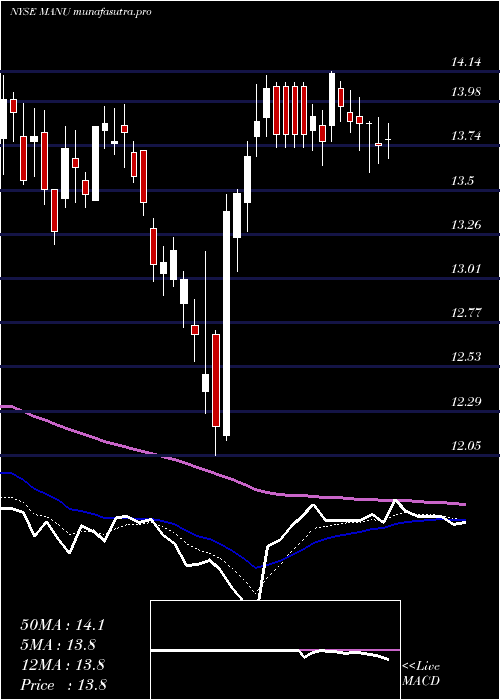
Wed 30 April 2025 |
13.74 (4.97%) |
13.04 |
12.05 - 14.14 |
0.8347 times |
Mon 31 March 2025 |
13.09 (-10.71%) |
14.73 |
13.00 - 14.82 |
1.021 times |
Fri 28 February 2025 |
14.66 (-7.62%) |
15.75 |
14.30 - 16.47 |
0.8559 times |
DMA SMA EMA moving averages of Manchester United MANU
DMA (daily moving average) of Manchester United MANU
| DMA period | DMA value | | 5 day DMA | 15.76 | | 12 day DMA | 15.58 | | 20 day DMA | 15.62 | | 35 day DMA | 16.45 | | 50 day DMA | 16.23 | | 100 day DMA | 16.69 | | 150 day DMA | 16.33 | | 200 day DMA | 15.72 | EMA (exponential moving average) of Manchester United MANU
| EMA period | EMA current | EMA prev | EMA prev2 | | 5 day EMA | 15.71 | 15.72 | 15.63 | | 12 day EMA | 15.69 | 15.69 | 15.65 | | 20 day EMA | 15.81 | 15.82 | 15.81 | | 35 day EMA | 15.91 | 15.92 | 15.92 | | 50 day EMA | 16.13 | 16.15 | 16.16 |
SMA (simple moving average) of Manchester United MANU
| SMA period | SMA current | SMA prev | SMA prev2 | | 5 day SMA | 15.76 | 15.75 | 15.67 | | 12 day SMA | 15.58 | 15.55 | 15.53 | | 20 day SMA | 15.62 | 15.62 | 15.61 | | 35 day SMA | 16.45 | 16.53 | 16.56 | | 50 day SMA | 16.23 | 16.22 | 16.21 | | 100 day SMA | 16.69 | 16.71 | 16.73 | | 150 day SMA | 16.33 | 16.32 | 16.3 | | 200 day SMA | 15.72 | 15.72 | 15.72 |
|
|
