MacerichCompany MAC full analysis,charts,indicators,moving averages,SMA,DMA,EMA,ADX,MACD,RSIMacerich Company MAC WideScreen charts, DMA,SMA,EMA technical analysis, forecast prediction, by indicators ADX,MACD,RSI,CCI NYSE stock exchange
operates under Consumer Services sector & deals in Real Estate Investment Trusts
Daily price and charts and targets MacerichCompany Strong Daily Stock price targets for MacerichCompany MAC are 17.5 and 18.07 | Daily Target 1 | 17.03 | | Daily Target 2 | 17.39 | | Daily Target 3 | 17.6 | | Daily Target 4 | 17.96 | | Daily Target 5 | 18.17 |
Daily price and volume Macerich Company
| Date |
Closing |
Open |
Range |
Volume |
Fri 05 December 2025 |
17.75 (2.25%) |
17.30 |
17.24 - 17.81 |
0.7868 times |
Thu 04 December 2025 |
17.36 (-0.46%) |
17.38 |
17.18 - 17.55 |
0.7177 times |
Wed 03 December 2025 |
17.44 (1.99%) |
17.17 |
17.00 - 17.51 |
0.8908 times |
Tue 02 December 2025 |
17.10 (-1.5%) |
17.41 |
17.10 - 17.50 |
0.9485 times |
Mon 01 December 2025 |
17.36 (0%) |
17.12 |
17.04 - 17.49 |
0.6819 times |
Fri 28 November 2025 |
17.36 (0.7%) |
17.30 |
17.14 - 17.53 |
0.7187 times |
Wed 26 November 2025 |
17.24 (1.35%) |
16.91 |
16.88 - 17.55 |
1.4886 times |
Tue 25 November 2025 |
17.01 (2.97%) |
16.55 |
16.55 - 17.14 |
0.8774 times |
Mon 24 November 2025 |
16.52 (-0.42%) |
16.60 |
16.37 - 16.76 |
1.2167 times |
Fri 21 November 2025 |
16.59 (2.41%) |
16.39 |
16.20 - 16.77 |
1.6728 times |
Thu 20 November 2025 |
16.20 (-0.12%) |
16.54 |
16.18 - 16.97 |
1.0416 times |
Weekly price and charts MacerichCompany Strong weekly Stock price targets for MacerichCompany MAC are 17.38 and 18.19 | Weekly Target 1 | 16.71 | | Weekly Target 2 | 17.23 | | Weekly Target 3 | 17.52 | | Weekly Target 4 | 18.04 | | Weekly Target 5 | 18.33 |
Weekly price and volumes for Macerich Company
| Date |
Closing |
Open |
Range |
Volume |
Fri 05 December 2025 |
17.75 (2.25%) |
17.12 |
17.00 - 17.81 |
0.8523 times |
Fri 28 November 2025 |
17.36 (4.64%) |
16.60 |
16.37 - 17.55 |
0.9106 times |
Fri 21 November 2025 |
16.59 (-3.6%) |
17.24 |
16.03 - 17.26 |
1.2686 times |
Fri 14 November 2025 |
17.21 (-4.5%) |
18.12 |
17.02 - 18.30 |
0.8518 times |
Fri 07 November 2025 |
18.02 (5.07%) |
17.27 |
17.16 - 18.05 |
1.3369 times |
Fri 31 October 2025 |
17.15 (0%) |
16.79 |
16.61 - 17.26 |
0.2967 times |
Fri 31 October 2025 |
17.15 (-4.83%) |
18.05 |
16.61 - 18.10 |
1.1658 times |
Fri 24 October 2025 |
18.02 (4.52%) |
17.33 |
17.02 - 18.15 |
0.9536 times |
Fri 17 October 2025 |
17.24 (4.55%) |
16.73 |
16.44 - 17.45 |
1.3549 times |
Fri 10 October 2025 |
16.49 (-8.59%) |
18.01 |
16.49 - 18.24 |
1.0087 times |
Fri 03 October 2025 |
18.04 (0.78%) |
18.00 |
17.51 - 18.31 |
1.7413 times |

Monthly price and charts MacerichCompany Strong monthly Stock price targets for MacerichCompany MAC are 17.38 and 18.19 | Monthly Target 1 | 16.71 | | Monthly Target 2 | 17.23 | | Monthly Target 3 | 17.52 | | Monthly Target 4 | 18.04 | | Monthly Target 5 | 18.33 |
Monthly price and volumes Macerich Company
| Date |
Closing |
Open |
Range |
Volume |
Fri 05 December 2025 |
17.75 (2.25%) |
17.12 |
17.00 - 17.81 |
0.1736 times |
Fri 28 November 2025 |
17.36 (1.22%) |
17.27 |
16.03 - 18.30 |
0.8899 times |
Fri 31 October 2025 |
17.15 (-5.77%) |
18.04 |
16.44 - 18.31 |
1.1525 times |
Tue 30 September 2025 |
18.20 (-1.09%) |
17.99 |
16.54 - 18.94 |
1.2677 times |
Fri 29 August 2025 |
18.40 (10.11%) |
16.48 |
15.94 - 18.65 |
0.9606 times |
Thu 31 July 2025 |
16.71 (3.28%) |
16.06 |
15.89 - 17.92 |
0.9124 times |
Mon 30 June 2025 |
16.18 (0%) |
15.94 |
15.48 - 17.04 |
0.8619 times |
Fri 30 May 2025 |
16.18 (10.37%) |
14.80 |
14.46 - 17.27 |
1.0483 times |
Wed 30 April 2025 |
14.66 (-14.62%) |
17.09 |
12.48 - 17.94 |
1.3252 times |
Mon 31 March 2025 |
17.17 (-4.82%) |
17.95 |
15.71 - 18.51 |
1.4078 times |
Fri 28 February 2025 |
18.04 (-13.19%) |
20.38 |
17.18 - 21.00 |
0.9736 times |

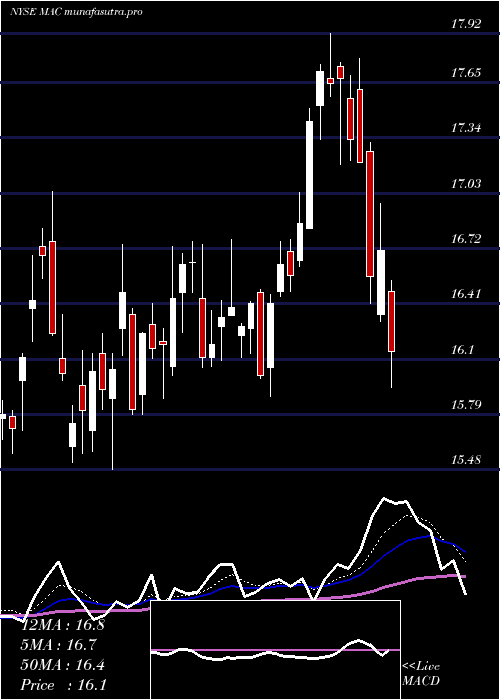
DMA SMA EMA moving averages of Macerich Company MAC
DMA (daily moving average) of Macerich Company MAC
| DMA period | DMA value | | 5 day DMA | 17.4 | | 12 day DMA | 17.01 | | 20 day DMA | 17.16 | | 35 day DMA | 17.3 | | 50 day DMA | 17.35 | | 100 day DMA | 17.44 | | 150 day DMA | 16.93 | | 200 day DMA | 16.74 | EMA (exponential moving average) of Macerich Company MAC
| EMA period | EMA current | EMA prev | EMA prev2 | | 5 day EMA | 17.43 | 17.27 | 17.23 | | 12 day EMA | 17.25 | 17.16 | 17.12 | | 20 day EMA | 17.23 | 17.17 | 17.15 | | 35 day EMA | 17.23 | 17.2 | 17.19 | | 50 day EMA | 17.33 | 17.31 | 17.31 |
SMA (simple moving average) of Macerich Company MAC
| SMA period | SMA current | SMA prev | SMA prev2 | | 5 day SMA | 17.4 | 17.32 | 17.3 | | 12 day SMA | 17.01 | 16.92 | 16.85 | | 20 day SMA | 17.16 | 17.14 | 17.16 | | 35 day SMA | 17.3 | 17.28 | 17.28 | | 50 day SMA | 17.35 | 17.33 | 17.31 | | 100 day SMA | 17.44 | 17.43 | 17.41 | | 150 day SMA | 16.93 | 16.91 | 16.89 | | 200 day SMA | 16.74 | 16.75 | 16.77 |
|
|
