LsbIndustries LXU full analysis,charts,indicators,moving averages,SMA,DMA,EMA,ADX,MACD,RSILsb Industries LXU WideScreen charts, DMA,SMA,EMA technical analysis, forecast prediction, by indicators ADX,MACD,RSI,CCI NYSE stock exchange
operates under Basic Industries sector & deals in Major Chemicals
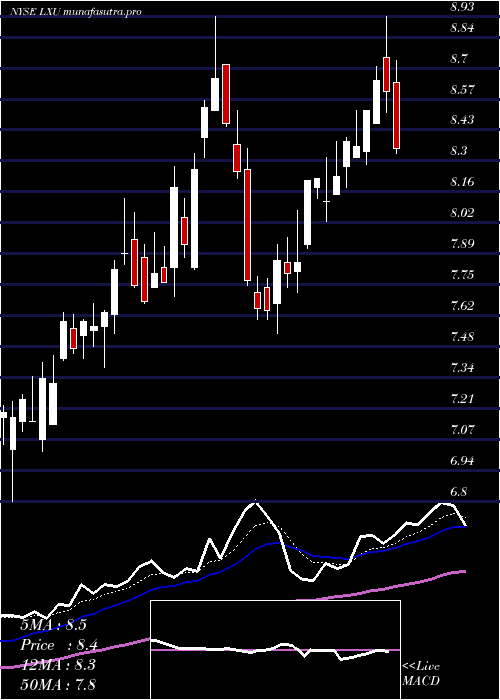
Daily price and charts and targets LsbIndustries Strong Daily Stock price targets for LsbIndustries LXU are 8.86 and 9.31 | Daily Target 1 | 8.77 | | Daily Target 2 | 8.94 | | Daily Target 3 | 9.22 | | Daily Target 4 | 9.39 | | Daily Target 5 | 9.67 |
Daily price and volume Lsb Industries
| Date |
Closing |
Open |
Range |
Volume |
Thu 04 December 2025 |
9.11 (-5.2%) |
9.50 |
9.05 - 9.50 |
1.2503 times |
Wed 03 December 2025 |
9.61 (1.37%) |
9.52 |
9.47 - 9.69 |
0.9979 times |
Tue 02 December 2025 |
9.48 (3.16%) |
9.41 |
9.31 - 9.92 |
1.8027 times |
Mon 01 December 2025 |
9.19 (2.91%) |
8.91 |
8.91 - 9.26 |
1.1864 times |
Fri 28 November 2025 |
8.93 (0.9%) |
8.92 |
8.81 - 9.03 |
0.4925 times |
Wed 26 November 2025 |
8.85 (-1.23%) |
8.95 |
8.78 - 8.96 |
0.8795 times |
Tue 25 November 2025 |
8.96 (2.87%) |
8.72 |
8.72 - 9.06 |
0.798 times |
Mon 24 November 2025 |
8.71 (-0.34%) |
8.74 |
8.44 - 8.77 |
0.733 times |
Fri 21 November 2025 |
8.74 (3.07%) |
8.47 |
8.20 - 8.83 |
1.0319 times |
Thu 20 November 2025 |
8.48 (-3.31%) |
8.91 |
8.44 - 8.98 |
0.8279 times |
Wed 19 November 2025 |
8.77 (-5.19%) |
9.15 |
8.59 - 9.22 |
0.9509 times |
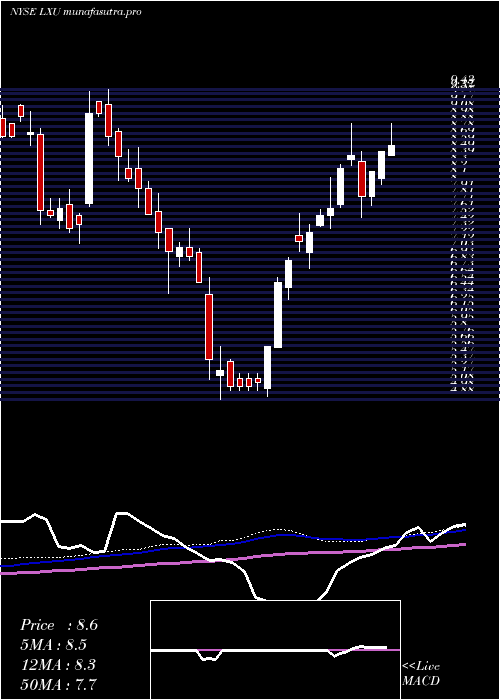
Weekly price and charts LsbIndustries Strong weekly Stock price targets for LsbIndustries LXU are 9.01 and 10.02 | Weekly Target 1 | 8.3 | | Weekly Target 2 | 8.71 | | Weekly Target 3 | 9.3133333333333 | | Weekly Target 4 | 9.72 | | Weekly Target 5 | 10.32 |
Weekly price and volumes for Lsb Industries
| Date |
Closing |
Open |
Range |
Volume |
Thu 04 December 2025 |
9.11 (2.02%) |
8.91 |
8.91 - 9.92 |
1.393 times |
Fri 28 November 2025 |
8.93 (2.17%) |
8.74 |
8.44 - 9.06 |
0.7721 times |
Fri 21 November 2025 |
8.74 (-9.99%) |
9.80 |
8.20 - 9.80 |
1.1683 times |
Fri 14 November 2025 |
9.71 (13.57%) |
8.88 |
8.76 - 9.98 |
1.2577 times |
Fri 07 November 2025 |
8.55 (1.42%) |
8.21 |
8.12 - 8.57 |
0.7666 times |
Fri 31 October 2025 |
8.43 (0%) |
8.32 |
8.24 - 8.80 |
0.2619 times |
Fri 31 October 2025 |
8.43 (-11.64%) |
9.55 |
8.21 - 9.85 |
1.4112 times |
Fri 24 October 2025 |
9.54 (15.08%) |
8.38 |
8.27 - 9.65 |
0.9291 times |
Fri 17 October 2025 |
8.29 (-2.36%) |
8.55 |
8.28 - 8.90 |
0.8601 times |
Fri 10 October 2025 |
8.49 (-5.56%) |
9.00 |
8.44 - 9.22 |
1.1798 times |
Fri 03 October 2025 |
8.99 (10.17%) |
8.20 |
7.71 - 9.00 |
0.9659 times |
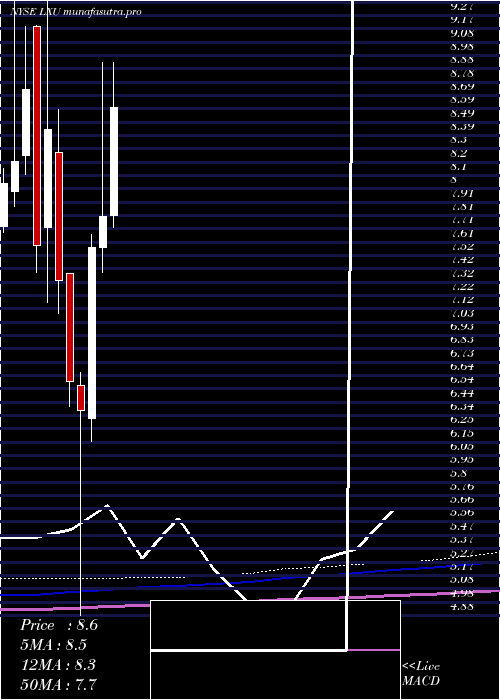
Monthly price and charts LsbIndustries Strong monthly Stock price targets for LsbIndustries LXU are 9.01 and 10.02 | Monthly Target 1 | 8.3 | | Monthly Target 2 | 8.71 | | Monthly Target 3 | 9.3133333333333 | | Monthly Target 4 | 9.72 | | Monthly Target 5 | 10.32 |
Monthly price and volumes Lsb Industries
| Date |
Closing |
Open |
Range |
Volume |
Thu 04 December 2025 |
9.11 (2.02%) |
8.91 |
8.91 - 9.92 |
0.319 times |
Fri 28 November 2025 |
8.93 (5.93%) |
8.21 |
8.12 - 9.98 |
0.908 times |
Fri 31 October 2025 |
8.43 (6.98%) |
7.82 |
7.71 - 9.85 |
1.2322 times |
Tue 30 September 2025 |
7.88 (-5.29%) |
8.23 |
7.72 - 8.47 |
0.7947 times |
Fri 29 August 2025 |
8.32 (7.63%) |
7.65 |
7.15 - 8.57 |
0.978 times |
Thu 31 July 2025 |
7.73 (-0.9%) |
7.81 |
7.09 - 8.93 |
1.095 times |
Mon 30 June 2025 |
7.80 (3.04%) |
7.57 |
7.39 - 8.93 |
1.1429 times |
Fri 30 May 2025 |
7.57 (18.65%) |
6.32 |
6.15 - 7.67 |
1.3179 times |
Wed 30 April 2025 |
6.38 (-3.19%) |
6.56 |
4.88 - 6.66 |
1.3286 times |
Mon 31 March 2025 |
6.59 (-10.1%) |
7.38 |
6.41 - 7.38 |
0.8836 times |
Fri 28 February 2025 |
7.33 (-13.15%) |
8.27 |
7.09 - 8.58 |
0.7508 times |
DMA SMA EMA moving averages of Lsb Industries LXU
DMA (daily moving average) of Lsb Industries LXU
| DMA period | DMA value | | 5 day DMA | 9.26 | | 12 day DMA | 9.01 | | 20 day DMA | 9.13 | | 35 day DMA | 8.95 | | 50 day DMA | 8.82 | | 100 day DMA | 8.45 | | 150 day DMA | 8.19 | | 200 day DMA | 7.74 | EMA (exponential moving average) of Lsb Industries LXU
| EMA period | EMA current | EMA prev | EMA prev2 | | 5 day EMA | 9.24 | 9.3 | 9.15 | | 12 day EMA | 9.14 | 9.14 | 9.06 | | 20 day EMA | 9.07 | 9.07 | 9.01 | | 35 day EMA | 8.94 | 8.93 | 8.89 | | 50 day EMA | 8.81 | 8.8 | 8.77 |
SMA (simple moving average) of Lsb Industries LXU
| SMA period | SMA current | SMA prev | SMA prev2 | | 5 day SMA | 9.26 | 9.21 | 9.08 | | 12 day SMA | 9.01 | 9.02 | 9.03 | | 20 day SMA | 9.13 | 9.1 | 9.02 | | 35 day SMA | 8.95 | 8.94 | 8.91 | | 50 day SMA | 8.82 | 8.8 | 8.77 | | 100 day SMA | 8.45 | 8.45 | 8.44 | | 150 day SMA | 8.19 | 8.17 | 8.15 | | 200 day SMA | 7.74 | 7.74 | 7.73 |
|
|
