LexingtonRealty LXP-C full analysis,charts,indicators,moving averages,SMA,DMA,EMA,ADX,MACD,RSILexington Realty LXP-C WideScreen charts, DMA,SMA,EMA technical analysis, forecast prediction, by indicators ADX,MACD,RSI,CCI NYSE stock exchange
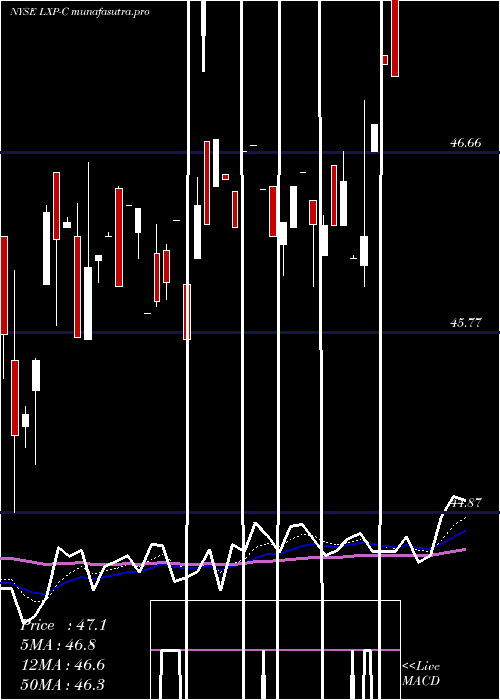
Daily price and charts and targets LexingtonRealty Strong Daily Stock price targets for LexingtonRealty LXP-C are 46.78 and 47.38 | Daily Target 1 | 46.35 | | Daily Target 2 | 46.6 | | Daily Target 3 | 46.95 | | Daily Target 4 | 47.2 | | Daily Target 5 | 47.55 |
Daily price and volume Lexington Realty
| Date |
Closing |
Open |
Range |
Volume |
Fri 05 December 2025 |
46.85 (-0.11%) |
46.78 |
46.70 - 47.30 |
0.8661 times |
Thu 04 December 2025 |
46.90 (-0.42%) |
46.91 |
46.90 - 47.29 |
1.063 times |
Wed 03 December 2025 |
47.10 (1.33%) |
46.62 |
46.62 - 47.10 |
0.748 times |
Tue 02 December 2025 |
46.48 (-0.98%) |
46.88 |
46.48 - 46.88 |
0.9055 times |
Mon 01 December 2025 |
46.94 (0.41%) |
46.77 |
46.77 - 47.07 |
0.7874 times |
Fri 28 November 2025 |
46.75 (-1.12%) |
47.13 |
46.75 - 47.43 |
1.7717 times |
Wed 26 November 2025 |
47.28 (-0.02%) |
47.50 |
47.28 - 47.52 |
0.5512 times |
Tue 25 November 2025 |
47.29 (-0.34%) |
47.23 |
47.23 - 47.57 |
0.6693 times |
Mon 24 November 2025 |
47.45 (0.42%) |
47.57 |
47.10 - 47.57 |
1.5748 times |
Fri 21 November 2025 |
47.25 (-0.19%) |
47.34 |
46.96 - 47.45 |
1.063 times |
Thu 20 November 2025 |
47.34 (0.62%) |
46.79 |
46.79 - 47.34 |
1.1811 times |
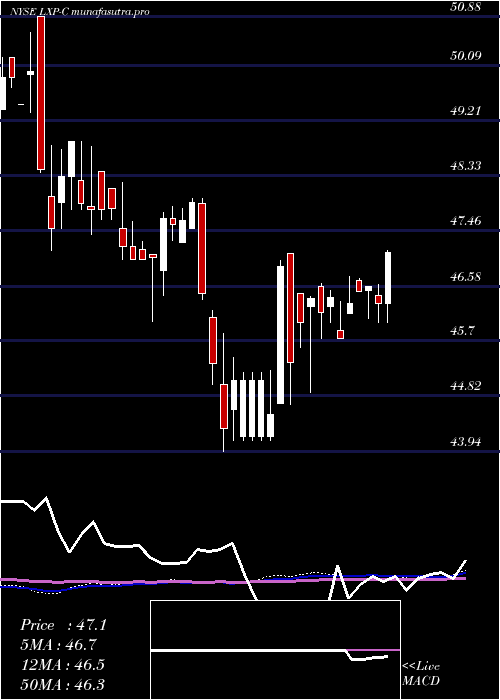
Weekly price and charts LexingtonRealty Strong weekly Stock price targets for LexingtonRealty LXP-C are 46.67 and 47.49 | Weekly Target 1 | 46.06 | | Weekly Target 2 | 46.45 | | Weekly Target 3 | 46.876666666667 | | Weekly Target 4 | 47.27 | | Weekly Target 5 | 47.7 |
Weekly price and volumes for Lexington Realty
| Date |
Closing |
Open |
Range |
Volume |
Fri 05 December 2025 |
46.85 (0.21%) |
46.77 |
46.48 - 47.30 |
1.414 times |
Fri 28 November 2025 |
46.75 (-1.06%) |
47.57 |
46.75 - 47.57 |
1.4777 times |
Fri 21 November 2025 |
47.25 (0.11%) |
47.56 |
46.75 - 47.56 |
1.3503 times |
Fri 14 November 2025 |
47.20 (1.51%) |
46.25 |
46.25 - 47.24 |
1.4522 times |
Fri 07 November 2025 |
46.50 (-1.63%) |
46.66 |
46.30 - 46.66 |
0.8662 times |
Fri 31 October 2025 |
47.27 (0%) |
46.95 |
46.95 - 47.39 |
0.1911 times |
Fri 31 October 2025 |
47.27 (-0.48%) |
47.17 |
46.95 - 48.00 |
1.0828 times |
Fri 24 October 2025 |
47.50 (-1.06%) |
47.53 |
47.50 - 47.82 |
0.7389 times |
Fri 17 October 2025 |
48.01 (1.2%) |
47.01 |
47.01 - 48.06 |
0.8025 times |
Fri 10 October 2025 |
47.44 (-1.41%) |
48.02 |
47.14 - 48.05 |
0.6242 times |
Fri 03 October 2025 |
48.12 (-0.27%) |
48.24 |
48.01 - 48.24 |
0.3439 times |
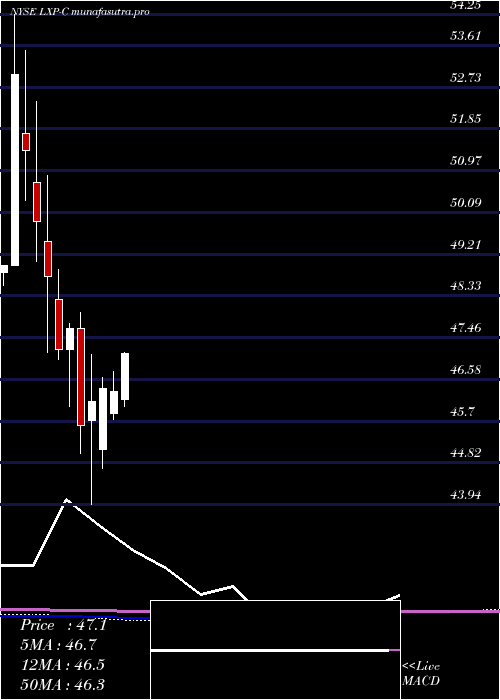
Monthly price and charts LexingtonRealty Strong monthly Stock price targets for LexingtonRealty LXP-C are 46.67 and 47.49 | Monthly Target 1 | 46.06 | | Monthly Target 2 | 46.45 | | Monthly Target 3 | 46.876666666667 | | Monthly Target 4 | 47.27 | | Monthly Target 5 | 47.7 |
Monthly price and volumes Lexington Realty
| Date |
Closing |
Open |
Range |
Volume |
Fri 05 December 2025 |
46.85 (0.21%) |
46.77 |
46.48 - 47.30 |
0.281 times |
Fri 28 November 2025 |
46.75 (-1.1%) |
46.66 |
46.25 - 47.57 |
1.0226 times |
Fri 31 October 2025 |
47.27 (-1.54%) |
48.08 |
46.95 - 48.20 |
0.7341 times |
Tue 30 September 2025 |
48.01 (3.14%) |
46.34 |
46.34 - 48.43 |
0.9112 times |
Fri 29 August 2025 |
46.55 (0.19%) |
46.17 |
46.04 - 47.96 |
1.4858 times |
Thu 31 July 2025 |
46.46 (0.32%) |
46.15 |
46.00 - 47.47 |
0.9019 times |
Mon 30 June 2025 |
46.31 (-0.17%) |
45.86 |
45.73 - 46.73 |
0.4684 times |
Fri 30 May 2025 |
46.39 (0.59%) |
45.11 |
44.69 - 46.62 |
1.0331 times |
Wed 30 April 2025 |
46.12 (1.14%) |
45.71 |
43.94 - 47.10 |
1.732 times |
Mon 31 March 2025 |
45.60 (-4.3%) |
47.65 |
45.01 - 47.98 |
1.4298 times |
Fri 28 February 2025 |
47.65 (0.95%) |
47.21 |
46.01 - 47.75 |
0.9011 times |
DMA SMA EMA moving averages of Lexington Realty LXP-C
DMA (daily moving average) of Lexington Realty LXP-C
| DMA period | DMA value | | 5 day DMA | 46.85 | | 12 day DMA | 47.06 | | 20 day DMA | 46.97 | | 35 day DMA | 47.14 | | 50 day DMA | 47.4 | | 100 day DMA | 47.17 | | 150 day DMA | 46.78 | | 200 day DMA | 46.78 | EMA (exponential moving average) of Lexington Realty LXP-C
| EMA period | EMA current | EMA prev | EMA prev2 | | 5 day EMA | 46.9 | 46.93 | 46.94 | | 12 day EMA | 46.97 | 46.99 | 47.01 | | 20 day EMA | 47.02 | 47.04 | 47.06 | | 35 day EMA | 47.21 | 47.23 | 47.25 | | 50 day EMA | 47.37 | 47.39 | 47.41 |
SMA (simple moving average) of Lexington Realty LXP-C
| SMA period | SMA current | SMA prev | SMA prev2 | | 5 day SMA | 46.85 | 46.83 | 46.91 | | 12 day SMA | 47.06 | 47.06 | 47.08 | | 20 day SMA | 46.97 | 46.95 | 46.93 | | 35 day SMA | 47.14 | 47.15 | 47.17 | | 50 day SMA | 47.4 | 47.42 | 47.44 | | 100 day SMA | 47.17 | 47.16 | 47.16 | | 150 day SMA | 46.78 | 46.76 | 46.75 | | 200 day SMA | 46.78 | 46.79 | 46.79 |
|
|
