SouthwestAirlines LUV full analysis,charts,indicators,moving averages,SMA,DMA,EMA,ADX,MACD,RSISouthwest Airlines LUV WideScreen charts, DMA,SMA,EMA technical analysis, forecast prediction, by indicators ADX,MACD,RSI,CCI NYSE stock exchange
operates under Transportation sector & deals in Air Freight Delivery Services
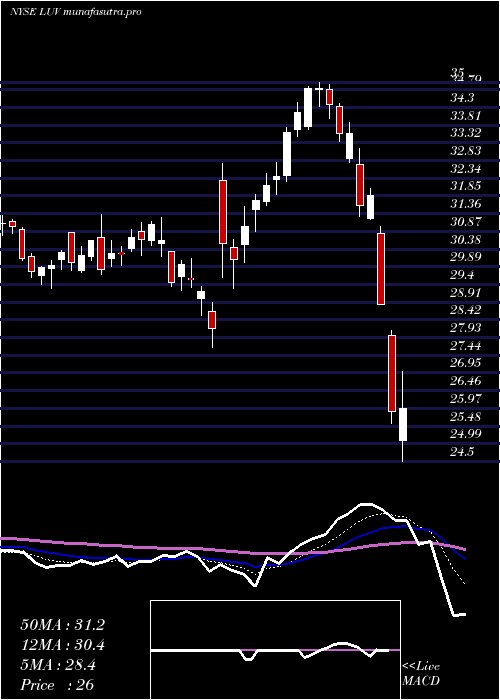
Daily price and charts and targets SouthwestAirlines Strong Daily Stock price targets for SouthwestAirlines LUV are 29.5 and 33.18 | Daily Target 1 | 28.78 | | Daily Target 2 | 30.22 | | Daily Target 3 | 32.46 | | Daily Target 4 | 33.9 | | Daily Target 5 | 36.14 |
Daily price and volume Southwest Airlines
| Date |
Closing |
Open |
Range |
Volume |
Thu 23 October 2025 |
31.66 (-6.14%) |
34.20 |
31.02 - 34.70 |
2.2334 times |
Wed 22 October 2025 |
33.73 (-2.74%) |
34.71 |
33.43 - 34.97 |
0.7782 times |
Tue 21 October 2025 |
34.68 (0.78%) |
34.12 |
34.06 - 34.98 |
1.0098 times |
Mon 20 October 2025 |
34.41 (2.66%) |
33.75 |
33.59 - 34.67 |
0.5355 times |
Fri 17 October 2025 |
33.52 (0.69%) |
33.23 |
33.19 - 33.79 |
0.8873 times |
Thu 16 October 2025 |
33.29 (-0.8%) |
33.67 |
32.84 - 34.05 |
1.1828 times |
Wed 15 October 2025 |
33.56 (0.42%) |
33.75 |
33.25 - 33.88 |
0.7976 times |
Tue 14 October 2025 |
33.42 (4.76%) |
31.52 |
31.42 - 33.63 |
1.1841 times |
Mon 13 October 2025 |
31.90 (-1.51%) |
31.73 |
31.56 - 32.32 |
0.5253 times |
Tue 07 October 2025 |
32.39 (-0.43%) |
32.57 |
32.09 - 32.76 |
0.866 times |
Mon 06 October 2025 |
32.53 (-0.21%) |
32.71 |
31.77 - 32.78 |
0.5966 times |
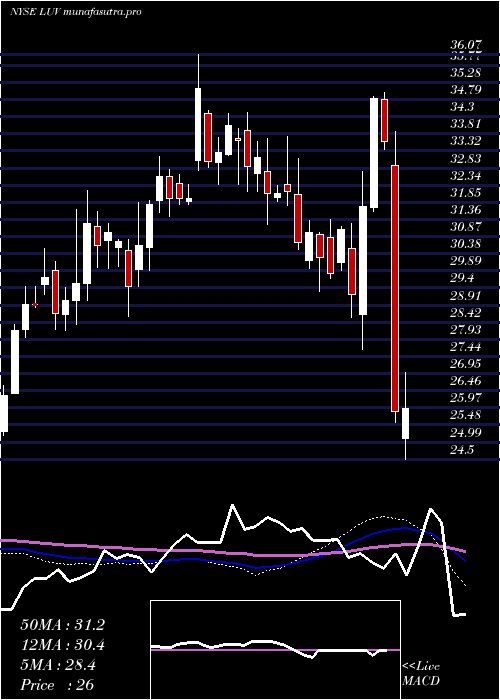
Weekly price and charts SouthwestAirlines Strong weekly Stock price targets for SouthwestAirlines LUV are 29.36 and 33.32 | Weekly Target 1 | 28.59 | | Weekly Target 2 | 30.13 | | Weekly Target 3 | 32.553333333333 | | Weekly Target 4 | 34.09 | | Weekly Target 5 | 36.51 |
Weekly price and volumes for Southwest Airlines
| Date |
Closing |
Open |
Range |
Volume |
Thu 23 October 2025 |
31.66 (-5.55%) |
33.75 |
31.02 - 34.98 |
1.187 times |
Fri 17 October 2025 |
33.52 (3.49%) |
31.73 |
31.42 - 34.05 |
1.1923 times |
Tue 07 October 2025 |
32.39 (-0.64%) |
32.71 |
31.77 - 32.78 |
0.381 times |
Fri 03 October 2025 |
32.60 (0.22%) |
32.76 |
30.76 - 33.49 |
1.1576 times |
Fri 26 September 2025 |
32.53 (0.03%) |
32.25 |
31.66 - 33.90 |
1.3605 times |
Fri 19 September 2025 |
32.52 (2.72%) |
31.76 |
30.71 - 32.75 |
1.6612 times |
Fri 12 September 2025 |
31.66 (0.86%) |
31.27 |
30.58 - 32.46 |
1.2767 times |
Fri 05 September 2025 |
31.39 (-4.59%) |
32.32 |
30.90 - 33.35 |
0.8416 times |
Fri 29 August 2025 |
32.90 (0%) |
33.02 |
32.63 - 33.07 |
0.1025 times |
Fri 29 August 2025 |
32.90 (0.4%) |
32.42 |
32.42 - 33.64 |
0.8396 times |
Fri 22 August 2025 |
32.77 (4.03%) |
31.34 |
30.55 - 32.87 |
0.8948 times |
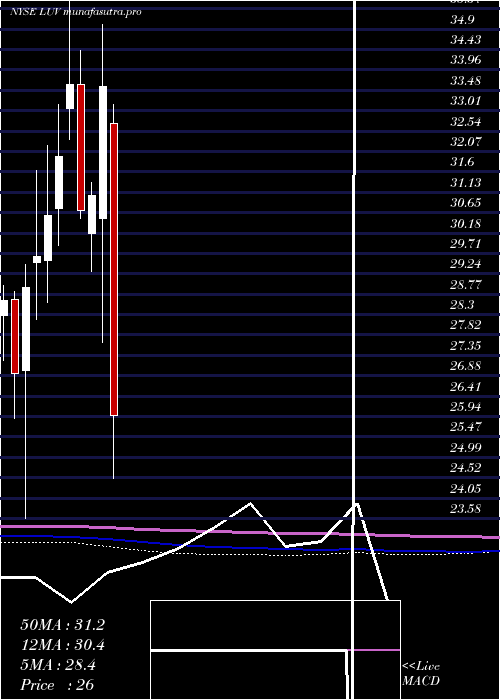
Monthly price and charts SouthwestAirlines Strong monthly Stock price targets for SouthwestAirlines LUV are 29.36 and 33.32 | Monthly Target 1 | 28.59 | | Monthly Target 2 | 30.13 | | Monthly Target 3 | 32.553333333333 | | Monthly Target 4 | 34.09 | | Monthly Target 5 | 36.51 |
Monthly price and volumes Southwest Airlines
| Date |
Closing |
Open |
Range |
Volume |
Thu 23 October 2025 |
31.66 (-0.78%) |
31.99 |
31.02 - 34.98 |
0.5545 times |
Tue 30 September 2025 |
31.91 (-3.01%) |
32.32 |
30.58 - 33.90 |
0.9339 times |
Fri 29 August 2025 |
32.90 (6.37%) |
30.28 |
28.98 - 33.64 |
0.6965 times |
Thu 31 July 2025 |
30.93 (-4.65%) |
32.21 |
30.37 - 37.96 |
1.3236 times |
Mon 30 June 2025 |
32.44 (-2.82%) |
33.45 |
30.72 - 34.62 |
0.9782 times |
Fri 30 May 2025 |
33.38 (19.38%) |
28.18 |
28.14 - 34.33 |
1.1184 times |
Wed 30 April 2025 |
27.96 (-16.74%) |
32.72 |
23.82 - 33.16 |
1.4139 times |
Mon 31 March 2025 |
33.58 (8.11%) |
30.53 |
27.65 - 35.00 |
1.3704 times |
Fri 28 February 2025 |
31.06 (1.14%) |
30.17 |
29.29 - 31.35 |
0.7517 times |
Fri 31 January 2025 |
30.71 (-8.66%) |
33.63 |
30.51 - 34.41 |
0.8589 times |
Tue 31 December 2024 |
33.62 (5.19%) |
33.06 |
32.35 - 36.07 |
0.4669 times |
DMA SMA EMA moving averages of Southwest Airlines LUV
DMA (daily moving average) of Southwest Airlines LUV
| DMA period | DMA value | | 5 day DMA | 33.6 | | 12 day DMA | 33.14 | | 20 day DMA | 32.89 | | 35 day DMA | 32.41 | | 50 day DMA | 32.28 | | 100 day DMA | 32.73 | | 150 day DMA | 31.64 | | 200 day DMA | 31.53 | EMA (exponential moving average) of Southwest Airlines LUV
| EMA period | EMA current | EMA prev | EMA prev2 | | 5 day EMA | 33.15 | 33.89 | 33.97 | | 12 day EMA | 33.14 | 33.41 | 33.35 | | 20 day EMA | 32.91 | 33.04 | 32.97 | | 35 day EMA | 32.54 | 32.59 | 32.52 | | 50 day EMA | 32.18 | 32.2 | 32.14 |
SMA (simple moving average) of Southwest Airlines LUV
| SMA period | SMA current | SMA prev | SMA prev2 | | 5 day SMA | 33.6 | 33.93 | 33.89 | | 12 day SMA | 33.14 | 33.2 | 33.07 | | 20 day SMA | 32.89 | 32.92 | 32.86 | | 35 day SMA | 32.41 | 32.44 | 32.42 | | 50 day SMA | 32.28 | 32.23 | 32.15 | | 100 day SMA | 32.73 | 32.74 | 32.71 | | 150 day SMA | 31.64 | 31.64 | 31.62 | | 200 day SMA | 31.53 | 31.54 | 31.54 |
|
|
