Centurylink LUMN full analysis,charts,indicators,moving averages,SMA,DMA,EMA,ADX,MACD,RSICenturylink LUMN WideScreen charts, DMA,SMA,EMA technical analysis, forecast prediction, by indicators ADX,MACD,RSI,CCI NYSE stock exchange
Daily price and charts and targets Centurylink Strong Daily Stock price targets for Centurylink LUMN are 7.92 and 8.57 | Daily Target 1 | 7.81 | | Daily Target 2 | 8.02 | | Daily Target 3 | 8.4566666666667 | | Daily Target 4 | 8.67 | | Daily Target 5 | 9.11 |
Daily price and volume Centurylink
| Date |
Closing |
Open |
Range |
Volume |
Fri 05 December 2025 |
8.24 (-6.04%) |
8.81 |
8.24 - 8.89 |
1.115 times |
Thu 04 December 2025 |
8.77 (-8.36%) |
9.52 |
8.76 - 9.62 |
1.1065 times |
Wed 03 December 2025 |
9.57 (4.7%) |
9.12 |
8.81 - 9.63 |
1.518 times |
Tue 02 December 2025 |
9.14 (10.25%) |
8.34 |
8.28 - 9.17 |
1.3178 times |
Mon 01 December 2025 |
8.29 (2.22%) |
7.95 |
7.89 - 8.31 |
1.1361 times |
Fri 28 November 2025 |
8.11 (0.25%) |
8.14 |
8.00 - 8.18 |
0.5122 times |
Wed 26 November 2025 |
8.09 (1%) |
8.07 |
7.95 - 8.25 |
0.68 times |
Tue 25 November 2025 |
8.01 (4.16%) |
7.68 |
7.60 - 8.11 |
0.8677 times |
Mon 24 November 2025 |
7.69 (1.32%) |
7.70 |
7.57 - 7.82 |
0.6533 times |
Fri 21 November 2025 |
7.59 (1.47%) |
7.50 |
7.28 - 7.78 |
1.0935 times |
Thu 20 November 2025 |
7.48 (-2.6%) |
8.09 |
7.41 - 8.16 |
1.2936 times |
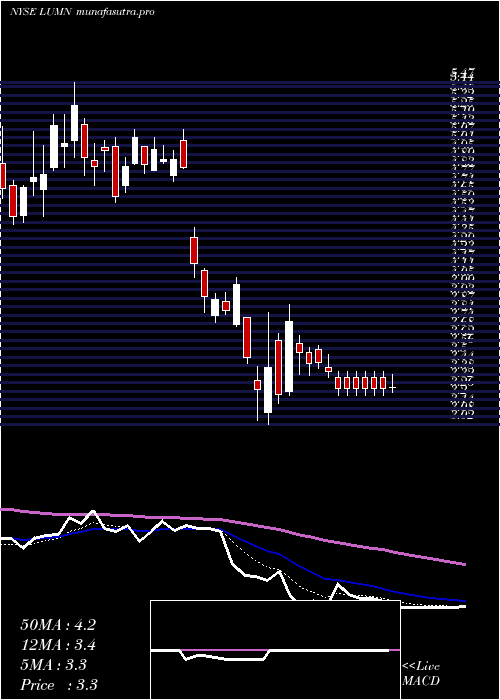
Weekly price and charts Centurylink Strong weekly Stock price targets for Centurylink LUMN are 8.07 and 9.81 | Weekly Target 1 | 6.85 | | Weekly Target 2 | 7.54 | | Weekly Target 3 | 8.5866666666667 | | Weekly Target 4 | 9.28 | | Weekly Target 5 | 10.33 |
Weekly price and volumes for Centurylink
| Date |
Closing |
Open |
Range |
Volume |
Fri 05 December 2025 |
8.24 (1.6%) |
7.95 |
7.89 - 9.63 |
0.8522 times |
Fri 28 November 2025 |
8.11 (6.85%) |
7.70 |
7.57 - 8.25 |
0.3734 times |
Fri 21 November 2025 |
7.59 (-5.01%) |
7.99 |
7.28 - 8.39 |
0.815 times |
Fri 14 November 2025 |
7.99 (-24.12%) |
10.90 |
7.60 - 11.39 |
1.1572 times |
Fri 07 November 2025 |
10.53 (2.43%) |
11.48 |
10.15 - 11.67 |
0.9707 times |
Fri 31 October 2025 |
10.28 (0%) |
8.70 |
8.14 - 10.40 |
0.5903 times |
Fri 31 October 2025 |
10.28 (27.07%) |
8.62 |
8.14 - 11.32 |
2.8361 times |
Fri 24 October 2025 |
8.09 (17.25%) |
6.87 |
6.76 - 8.40 |
0.827 times |
Fri 17 October 2025 |
6.90 (5.34%) |
6.62 |
6.60 - 7.46 |
0.821 times |
Fri 03 October 2025 |
6.55 (10.64%) |
5.90 |
5.70 - 6.60 |
0.7571 times |
Fri 26 September 2025 |
5.92 (3.68%) |
5.75 |
5.52 - 6.62 |
1.2051 times |
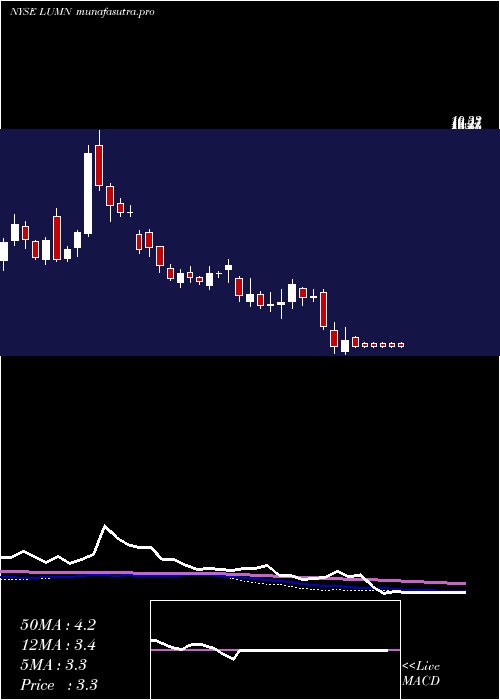
Monthly price and charts Centurylink Strong monthly Stock price targets for Centurylink LUMN are 8.07 and 9.81 | Monthly Target 1 | 6.85 | | Monthly Target 2 | 7.54 | | Monthly Target 3 | 8.5866666666667 | | Monthly Target 4 | 9.28 | | Monthly Target 5 | 10.33 |
Monthly price and volumes Centurylink
| Date |
Closing |
Open |
Range |
Volume |
Fri 05 December 2025 |
8.24 (1.6%) |
7.95 |
7.89 - 9.63 |
0.2665 times |
Fri 28 November 2025 |
8.11 (-21.11%) |
11.48 |
7.28 - 11.67 |
1.037 times |
Fri 31 October 2025 |
10.28 (67.97%) |
6.05 |
5.86 - 11.32 |
1.7308 times |
Tue 30 September 2025 |
6.12 (23.14%) |
4.82 |
4.57 - 6.65 |
1.5617 times |
Fri 29 August 2025 |
4.97 (11.69%) |
4.02 |
3.37 - 5.55 |
1.0831 times |
Thu 31 July 2025 |
4.45 (1.6%) |
4.39 |
4.27 - 4.72 |
0.6891 times |
Mon 30 June 2025 |
4.38 (11.73%) |
3.92 |
3.77 - 4.57 |
0.8986 times |
Fri 30 May 2025 |
3.92 (10.73%) |
3.67 |
3.43 - 4.74 |
0.9332 times |
Wed 30 April 2025 |
3.54 (-9.69%) |
3.90 |
3.01 - 4.07 |
0.8696 times |
Mon 31 March 2025 |
3.92 (-16.95%) |
4.76 |
3.75 - 5.47 |
0.9304 times |
Fri 28 February 2025 |
4.72 (-4.45%) |
4.73 |
4.20 - 5.51 |
0.9279 times |

DMA SMA EMA moving averages of Centurylink LUMN
DMA (daily moving average) of Centurylink LUMN
| DMA period | DMA value | | 5 day DMA | 8.8 | | 12 day DMA | 8.22 | | 20 day DMA | 8.46 | | 35 day DMA | 8.77 | | 50 day DMA | 8.03 | | 100 day DMA | 6.36 | | 150 day DMA | 5.6 | | 200 day DMA | 5.25 | EMA (exponential moving average) of Centurylink LUMN
| EMA period | EMA current | EMA prev | EMA prev2 | | 5 day EMA | 8.61 | 8.8 | 8.81 | | 12 day EMA | 8.52 | 8.57 | 8.53 | | 20 day EMA | 8.5 | 8.53 | 8.5 | | 35 day EMA | 8.11 | 8.1 | 8.06 | | 50 day EMA | 7.92 | 7.91 | 7.87 |
SMA (simple moving average) of Centurylink LUMN
| SMA period | SMA current | SMA prev | SMA prev2 | | 5 day SMA | 8.8 | 8.78 | 8.64 | | 12 day SMA | 8.22 | 8.17 | 8.11 | | 20 day SMA | 8.46 | 8.6 | 8.7 | | 35 day SMA | 8.77 | 8.74 | 8.7 | | 50 day SMA | 8.03 | 7.98 | 7.92 | | 100 day SMA | 6.36 | 6.32 | 6.28 | | 150 day SMA | 5.6 | 5.57 | 5.53 | | 200 day SMA | 5.25 | 5.23 | 5.21 |
|
|
