LtcProperties LTC full analysis,charts,indicators,moving averages,SMA,DMA,EMA,ADX,MACD,RSILtc Properties LTC WideScreen charts, DMA,SMA,EMA technical analysis, forecast prediction, by indicators ADX,MACD,RSI,CCI NYSE stock exchange
operates under Consumer Services sector & deals in Real Estate Investment Trusts
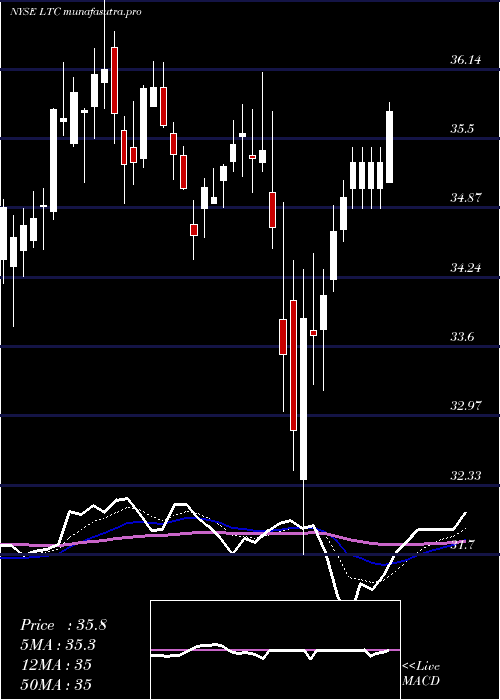
Daily price and charts and targets LtcProperties Strong Daily Stock price targets for LtcProperties LTC are 35.34 and 35.74 | Daily Target 1 | 35 | | Daily Target 2 | 35.27 | | Daily Target 3 | 35.403333333333 | | Daily Target 4 | 35.67 | | Daily Target 5 | 35.8 |
Daily price and volume Ltc Properties
| Date |
Closing |
Open |
Range |
Volume |
Mon 20 October 2025 |
35.53 (0.88%) |
35.31 |
35.14 - 35.54 |
0.9106 times |
Fri 17 October 2025 |
35.22 (1.73%) |
34.65 |
34.65 - 35.24 |
1.2967 times |
Thu 16 October 2025 |
34.62 (-0.14%) |
34.73 |
34.53 - 34.96 |
0.9042 times |
Wed 15 October 2025 |
34.67 (1.34%) |
34.32 |
34.25 - 34.70 |
0.9852 times |
Tue 14 October 2025 |
34.21 (0.68%) |
33.86 |
33.86 - 34.59 |
1.1376 times |
Mon 13 October 2025 |
33.98 (-2.69%) |
34.20 |
33.77 - 34.63 |
1.1413 times |
Tue 07 October 2025 |
34.92 (-0.51%) |
35.00 |
34.48 - 35.04 |
1.2389 times |
Mon 06 October 2025 |
35.10 (-2.5%) |
36.00 |
35.04 - 36.15 |
0.7733 times |
Fri 03 October 2025 |
36.00 (-1.23%) |
36.50 |
36.00 - 36.79 |
0.9988 times |
Thu 02 October 2025 |
36.45 (-1.57%) |
36.81 |
36.27 - 37.04 |
0.6135 times |
Wed 01 October 2025 |
37.03 (0.46%) |
36.84 |
36.84 - 37.25 |
1.3605 times |
Weekly price and charts LtcProperties Strong weekly Stock price targets for LtcProperties LTC are 35.34 and 35.74 | Weekly Target 1 | 35 | | Weekly Target 2 | 35.27 | | Weekly Target 3 | 35.403333333333 | | Weekly Target 4 | 35.67 | | Weekly Target 5 | 35.8 |
Weekly price and volumes for Ltc Properties
| Date |
Closing |
Open |
Range |
Volume |
Mon 20 October 2025 |
35.53 (0.88%) |
35.31 |
35.14 - 35.54 |
0.202 times |
Fri 17 October 2025 |
35.22 (0.86%) |
34.20 |
33.77 - 35.24 |
1.2123 times |
Tue 07 October 2025 |
34.92 (-3%) |
36.00 |
34.48 - 36.15 |
0.4464 times |
Fri 03 October 2025 |
36.00 (-1.67%) |
36.49 |
36.00 - 37.25 |
1.3996 times |
Fri 26 September 2025 |
36.61 (2.23%) |
35.50 |
35.10 - 36.66 |
2.1598 times |
Fri 19 September 2025 |
35.81 (-1.13%) |
36.30 |
35.33 - 36.47 |
1.4667 times |
Fri 12 September 2025 |
36.22 (-1.09%) |
36.35 |
36.21 - 36.84 |
0.8853 times |
Fri 05 September 2025 |
36.62 (0.33%) |
36.45 |
36.04 - 36.69 |
0.8303 times |
Fri 29 August 2025 |
36.50 (0%) |
36.47 |
36.31 - 36.66 |
0.2043 times |
Fri 29 August 2025 |
36.50 (-0.82%) |
36.76 |
35.81 - 36.95 |
1.1932 times |
Fri 22 August 2025 |
36.80 (3.6%) |
35.62 |
35.44 - 37.19 |
1.4956 times |

Monthly price and charts LtcProperties Strong monthly Stock price targets for LtcProperties LTC are 32.91 and 36.39 | Monthly Target 1 | 32.04 | | Monthly Target 2 | 33.78 | | Monthly Target 3 | 35.516666666667 | | Monthly Target 4 | 37.26 | | Monthly Target 5 | 39 |
Monthly price and volumes Ltc Properties
| Date |
Closing |
Open |
Range |
Volume |
Mon 20 October 2025 |
35.53 (-3.61%) |
36.84 |
33.77 - 37.25 |
0.4938 times |
Tue 30 September 2025 |
36.86 (0.99%) |
36.45 |
35.10 - 37.05 |
1.1918 times |
Fri 29 August 2025 |
36.50 (7.23%) |
34.56 |
33.89 - 37.19 |
1.1563 times |
Thu 31 July 2025 |
34.04 (-1.65%) |
34.87 |
33.95 - 35.84 |
1.2261 times |
Mon 30 June 2025 |
34.61 (-2.2%) |
35.25 |
34.20 - 35.76 |
0.8913 times |
Fri 30 May 2025 |
35.39 (-1.34%) |
35.68 |
34.11 - 36.99 |
1.0431 times |
Wed 30 April 2025 |
35.87 (1.18%) |
35.52 |
31.70 - 36.22 |
0.9354 times |
Mon 31 March 2025 |
35.45 (1.61%) |
34.84 |
34.40 - 36.77 |
1.0191 times |
Fri 28 February 2025 |
34.89 (1.42%) |
34.15 |
33.36 - 35.12 |
0.9981 times |
Fri 31 January 2025 |
34.40 (-0.43%) |
34.56 |
32.94 - 35.59 |
1.0449 times |
Tue 31 December 2024 |
34.55 (-11.21%) |
38.09 |
34.06 - 38.20 |
0.7992 times |

DMA SMA EMA moving averages of Ltc Properties LTC
DMA (daily moving average) of Ltc Properties LTC
| DMA period | DMA value | | 5 day DMA | 34.85 | | 12 day DMA | 35.38 | | 20 day DMA | 35.61 | | 35 day DMA | 35.91 | | 50 day DMA | 35.93 | | 100 day DMA | 35.51 | | 150 day DMA | 35.43 | | 200 day DMA | 35.22 | EMA (exponential moving average) of Ltc Properties LTC
| EMA period | EMA current | EMA prev | EMA prev2 | | 5 day EMA | 35.09 | 34.87 | 34.7 | | 12 day EMA | 35.25 | 35.2 | 35.2 | | 20 day EMA | 35.47 | 35.46 | 35.48 | | 35 day EMA | 35.61 | 35.62 | 35.64 | | 50 day EMA | 35.7 | 35.71 | 35.73 |
SMA (simple moving average) of Ltc Properties LTC
| SMA period | SMA current | SMA prev | SMA prev2 | | 5 day SMA | 34.85 | 34.54 | 34.48 | | 12 day SMA | 35.38 | 35.45 | 35.56 | | 20 day SMA | 35.61 | 35.61 | 35.63 | | 35 day SMA | 35.91 | 35.94 | 35.97 | | 50 day SMA | 35.93 | 35.92 | 35.92 | | 100 day SMA | 35.51 | 35.51 | 35.51 | | 150 day SMA | 35.43 | 35.43 | 35.43 | | 200 day SMA | 35.22 | 35.22 | 35.21 |
|
|
