K12Inc LRN full analysis,charts,indicators,moving averages,SMA,DMA,EMA,ADX,MACD,RSIK12 Inc LRN WideScreen charts, DMA,SMA,EMA technical analysis, forecast prediction, by indicators ADX,MACD,RSI,CCI NYSE stock exchange
operates under Consumer Services sector & deals in Other Consumer Services
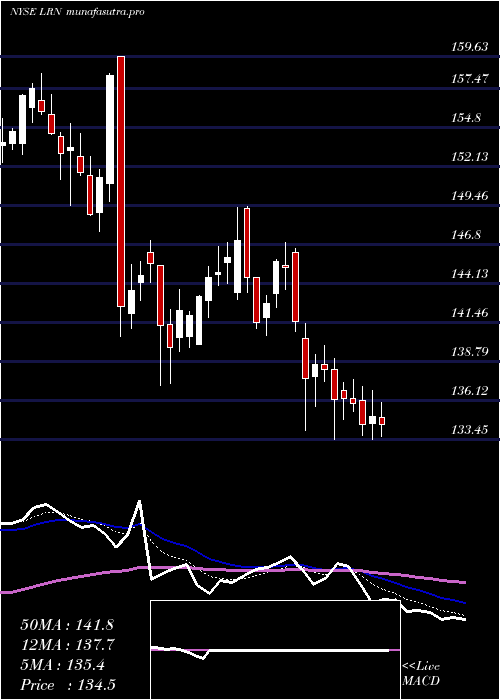
Daily price and charts and targets K12Inc Strong Daily Stock price targets for K12Inc LRN are 143.49 and 146.66 | Daily Target 1 | 142.79 | | Daily Target 2 | 144.19 | | Daily Target 3 | 145.96 | | Daily Target 4 | 147.36 | | Daily Target 5 | 149.13 |
Daily price and volume K12 Inc
| Date |
Closing |
Open |
Range |
Volume |
Mon 20 October 2025 |
145.59 (0.44%) |
146.05 |
144.56 - 147.73 |
3.7342 times |
Fri 17 October 2025 |
144.95 (3.04%) |
140.15 |
140.15 - 145.08 |
0.7504 times |
Thu 16 October 2025 |
140.68 (-3.81%) |
145.27 |
137.69 - 145.76 |
1.1951 times |
Wed 15 October 2025 |
146.25 (-0.1%) |
145.43 |
145.05 - 148.19 |
1.2954 times |
Tue 14 October 2025 |
146.40 (0.97%) |
144.55 |
143.67 - 146.43 |
0.4299 times |
Mon 13 October 2025 |
144.99 (3.56%) |
143.52 |
143.52 - 146.13 |
0.5563 times |
Tue 07 October 2025 |
140.00 (-0.46%) |
140.21 |
138.94 - 141.63 |
0.6139 times |
Mon 06 October 2025 |
140.65 (-2.03%) |
142.56 |
139.62 - 142.56 |
0.4705 times |
Fri 03 October 2025 |
143.56 (-1.16%) |
145.58 |
142.88 - 147.08 |
0.6263 times |
Thu 02 October 2025 |
145.24 (0.49%) |
144.54 |
143.16 - 146.00 |
0.3279 times |
Wed 01 October 2025 |
144.53 (-2.96%) |
147.95 |
143.93 - 149.53 |
0.7644 times |
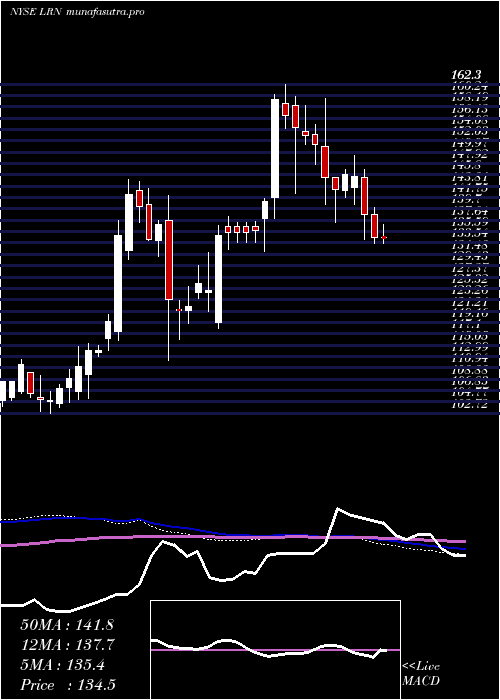
Weekly price and charts K12Inc Strong weekly Stock price targets for K12Inc LRN are 143.49 and 146.66 | Weekly Target 1 | 142.79 | | Weekly Target 2 | 144.19 | | Weekly Target 3 | 145.96 | | Weekly Target 4 | 147.36 | | Weekly Target 5 | 149.13 |
Weekly price and volumes for K12 Inc
| Date |
Closing |
Open |
Range |
Volume |
Mon 20 October 2025 |
145.59 (0.44%) |
146.05 |
144.56 - 147.73 |
0.9595 times |
Fri 17 October 2025 |
144.95 (3.54%) |
143.52 |
137.69 - 148.19 |
1.0862 times |
Tue 07 October 2025 |
140.00 (-2.48%) |
142.56 |
138.94 - 142.56 |
0.2786 times |
Fri 03 October 2025 |
143.56 (-3.24%) |
148.36 |
142.88 - 152.14 |
1.2093 times |
Fri 26 September 2025 |
148.36 (4.69%) |
142.96 |
141.61 - 149.43 |
1.285 times |
Fri 19 September 2025 |
141.71 (-10.51%) |
158.00 |
135.51 - 158.40 |
2.4203 times |
Fri 12 September 2025 |
158.36 (-1.47%) |
160.49 |
157.33 - 166.93 |
0.8996 times |
Fri 05 September 2025 |
160.73 (-1.51%) |
160.81 |
157.20 - 164.49 |
0.602 times |
Fri 29 August 2025 |
163.19 (0%) |
166.48 |
162.16 - 166.91 |
0.2025 times |
Fri 29 August 2025 |
163.19 (-1.2%) |
165.29 |
162.16 - 171.17 |
1.0571 times |
Fri 22 August 2025 |
165.17 (3.11%) |
159.94 |
159.94 - 169.87 |
0.9682 times |
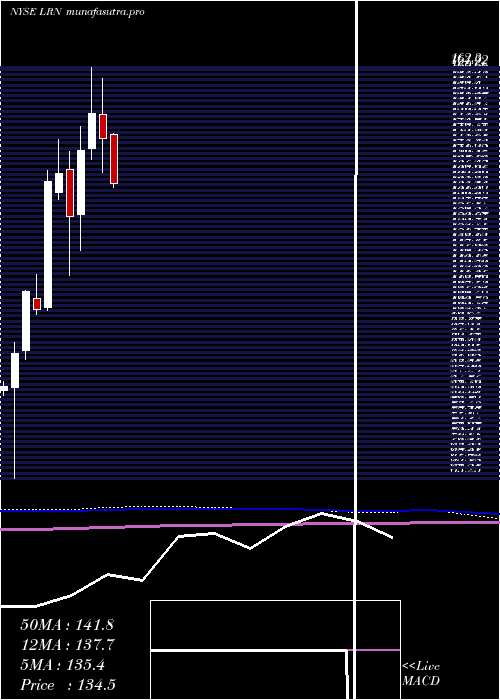
Monthly price and charts K12Inc Strong monthly Stock price targets for K12Inc LRN are 135.72 and 147.56 | Monthly Target 1 | 132.43 | | Monthly Target 2 | 139.01 | | Monthly Target 3 | 144.27 | | Monthly Target 4 | 150.85 | | Monthly Target 5 | 156.11 |
Monthly price and volumes K12 Inc
| Date |
Closing |
Open |
Range |
Volume |
Mon 20 October 2025 |
145.59 (-2.25%) |
147.95 |
137.69 - 149.53 |
0.5637 times |
Tue 30 September 2025 |
148.94 (-8.73%) |
160.81 |
135.51 - 166.93 |
1.2178 times |
Fri 29 August 2025 |
163.19 (27.26%) |
129.57 |
127.84 - 171.17 |
1.0784 times |
Thu 31 July 2025 |
128.23 (-11.68%) |
146.26 |
126.89 - 146.50 |
0.8294 times |
Mon 30 June 2025 |
145.19 (-4.1%) |
150.97 |
137.15 - 159.63 |
0.9262 times |
Fri 30 May 2025 |
151.39 (6.43%) |
142.92 |
140.12 - 162.30 |
1.0843 times |
Wed 30 April 2025 |
142.25 (12.45%) |
126.91 |
118.13 - 148.03 |
0.9837 times |
Mon 31 March 2025 |
126.50 (-7.53%) |
137.68 |
112.28 - 142.13 |
0.9831 times |
Fri 28 February 2025 |
136.80 (1.41%) |
132.20 |
130.55 - 145.00 |
0.9302 times |
Fri 31 January 2025 |
134.90 (29.8%) |
104.49 |
103.74 - 137.54 |
1.4031 times |
Tue 31 December 2024 |
103.93 (-4.17%) |
106.72 |
102.72 - 112.53 |
0.5961 times |
DMA SMA EMA moving averages of K12 Inc LRN
DMA (daily moving average) of K12 Inc LRN
| DMA period | DMA value | | 5 day DMA | 144.77 | | 12 day DMA | 144.32 | | 20 day DMA | 144.56 | | 35 day DMA | 150.1 | | 50 day DMA | 153.18 | | 100 day DMA | 146.56 | | 150 day DMA | 143.75 | | 200 day DMA | 139.25 | EMA (exponential moving average) of K12 Inc LRN
| EMA period | EMA current | EMA prev | EMA prev2 | | 5 day EMA | 144.54 | 144.02 | 143.56 | | 12 day EMA | 144.74 | 144.59 | 144.53 | | 20 day EMA | 145.8 | 145.82 | 145.91 | | 35 day EMA | 147.94 | 148.08 | 148.26 | | 50 day EMA | 150.65 | 150.86 | 151.1 |
SMA (simple moving average) of K12 Inc LRN
| SMA period | SMA current | SMA prev | SMA prev2 | | 5 day SMA | 144.77 | 144.65 | 143.66 | | 12 day SMA | 144.32 | 144.68 | 144.96 | | 20 day SMA | 144.56 | 144.21 | 143.93 | | 35 day SMA | 150.1 | 150.79 | 151.5 | | 50 day SMA | 153.18 | 153.23 | 152.9 | | 100 day SMA | 146.56 | 146.67 | 146.79 | | 150 day SMA | 143.75 | 143.57 | 143.41 | | 200 day SMA | 139.25 | 139.05 | 138.85 |
|
|
