LgDisplay LPL full analysis,charts,indicators,moving averages,SMA,DMA,EMA,ADX,MACD,RSILg Display LPL WideScreen charts, DMA,SMA,EMA technical analysis, forecast prediction, by indicators ADX,MACD,RSI,CCI NYSE stock exchange
operates under Capital Goods sector & deals in Industrial Machinery Components
Daily price and charts and targets LgDisplay Strong Daily Stock price targets for LgDisplay LPL are 4.42 and 4.46 | Daily Target 1 | 4.39 | | Daily Target 2 | 4.41 | | Daily Target 3 | 4.4266666666667 | | Daily Target 4 | 4.45 | | Daily Target 5 | 4.47 |
Daily price and volume Lg Display
| Date |
Closing |
Open |
Range |
Volume |
Thu 04 December 2025 |
4.44 (0.68%) |
4.40 |
4.40 - 4.44 |
0.6542 times |
Wed 03 December 2025 |
4.41 (0.23%) |
4.40 |
4.39 - 4.42 |
1.0044 times |
Tue 02 December 2025 |
4.40 (3.29%) |
4.34 |
4.33 - 4.40 |
1.2385 times |
Mon 01 December 2025 |
4.26 (-1.62%) |
4.27 |
4.26 - 4.32 |
0.845 times |
Fri 28 November 2025 |
4.33 (-0.69%) |
4.30 |
4.30 - 4.37 |
0.6159 times |
Wed 26 November 2025 |
4.36 (2.11%) |
4.32 |
4.32 - 4.39 |
0.8826 times |
Tue 25 November 2025 |
4.27 (0%) |
4.22 |
4.22 - 4.30 |
1.7346 times |
Mon 24 November 2025 |
4.27 (1.67%) |
4.17 |
4.17 - 4.28 |
1.0454 times |
Fri 21 November 2025 |
4.20 (0%) |
4.19 |
4.12 - 4.21 |
0.8445 times |
Thu 20 November 2025 |
4.20 (-1.64%) |
4.34 |
4.16 - 4.34 |
1.135 times |
Wed 19 November 2025 |
4.27 (-0.23%) |
4.31 |
4.26 - 4.33 |
0.9388 times |
Weekly price and charts LgDisplay Strong weekly Stock price targets for LgDisplay LPL are 4.35 and 4.53 | Weekly Target 1 | 4.2 | | Weekly Target 2 | 4.32 | | Weekly Target 3 | 4.38 | | Weekly Target 4 | 4.5 | | Weekly Target 5 | 4.56 |
Weekly price and volumes for Lg Display
| Date |
Closing |
Open |
Range |
Volume |
Thu 04 December 2025 |
4.44 (2.54%) |
4.27 |
4.26 - 4.44 |
0.599 times |
Fri 28 November 2025 |
4.33 (3.1%) |
4.17 |
4.17 - 4.39 |
0.6849 times |
Fri 21 November 2025 |
4.20 (-6.04%) |
4.36 |
4.12 - 4.40 |
1.127 times |
Fri 14 November 2025 |
4.47 (-1.97%) |
4.66 |
4.34 - 4.70 |
0.8762 times |
Fri 07 November 2025 |
4.56 (-8.98%) |
4.85 |
4.48 - 5.00 |
1.2249 times |
Fri 31 October 2025 |
5.01 (0%) |
5.03 |
4.99 - 5.13 |
0.3276 times |
Fri 31 October 2025 |
5.01 (1.21%) |
5.08 |
4.82 - 5.17 |
1.5619 times |
Fri 24 October 2025 |
4.95 (-4.07%) |
5.23 |
4.86 - 5.30 |
1.5423 times |
Fri 17 October 2025 |
5.16 (-4.62%) |
5.36 |
4.96 - 5.38 |
1.5815 times |
Tue 07 October 2025 |
5.41 (0.56%) |
5.50 |
5.30 - 5.50 |
0.4747 times |
Fri 03 October 2025 |
5.38 (5.7%) |
5.23 |
5.14 - 5.44 |
1.0294 times |
Monthly price and charts LgDisplay Strong monthly Stock price targets for LgDisplay LPL are 4.35 and 4.53 | Monthly Target 1 | 4.2 | | Monthly Target 2 | 4.32 | | Monthly Target 3 | 4.38 | | Monthly Target 4 | 4.5 | | Monthly Target 5 | 4.56 |
Monthly price and volumes Lg Display
| Date |
Closing |
Open |
Range |
Volume |
Thu 04 December 2025 |
4.44 (2.54%) |
4.27 |
4.26 - 4.44 |
0.1917 times |
Fri 28 November 2025 |
4.33 (-13.57%) |
4.85 |
4.12 - 5.00 |
1.2522 times |
Fri 31 October 2025 |
5.01 (-4.02%) |
5.23 |
4.82 - 5.50 |
1.9217 times |
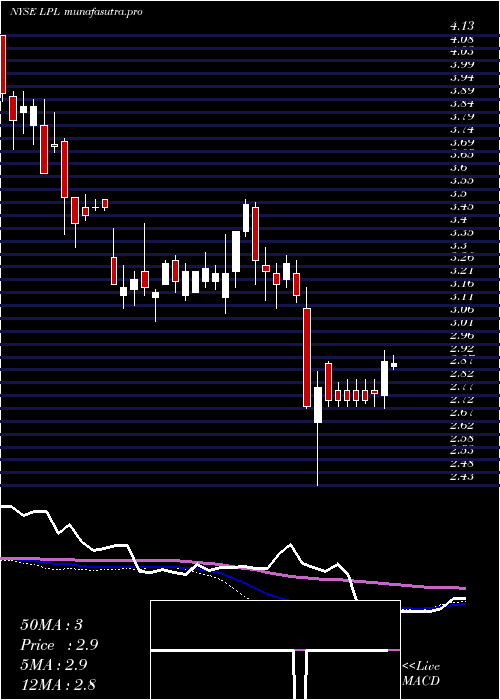
Tue 30 September 2025 |
5.22 (18.37%) |
4.33 |
4.24 - 5.30 |
1.7034 times |
Fri 29 August 2025 |
4.41 (12.5%) |
3.89 |
3.83 - 4.97 |
1.6275 times |
Thu 31 July 2025 |
3.92 (14.62%) |
3.42 |
3.30 - 3.94 |
0.8849 times |
Mon 30 June 2025 |
3.42 (7.89%) |
3.14 |
3.07 - 3.60 |
0.5092 times |
Fri 30 May 2025 |
3.17 (8.19%) |
2.94 |
2.93 - 3.25 |
0.5373 times |
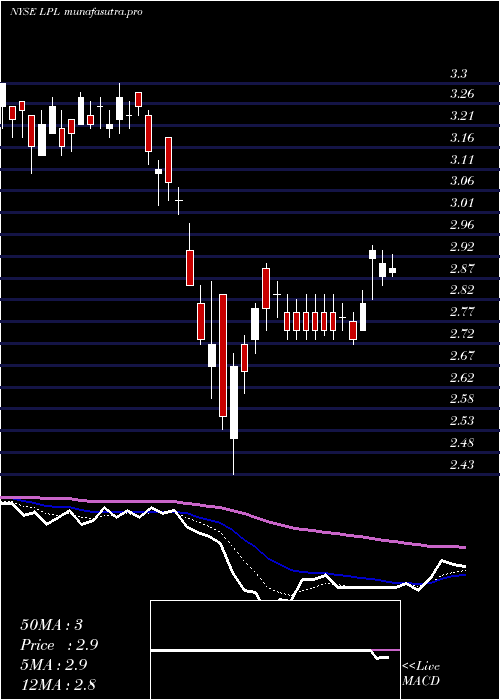
Wed 30 April 2025 |
2.93 (-5.79%) |
3.18 |
2.43 - 3.18 |
0.9443 times |
Mon 31 March 2025 |
3.11 (-5.18%) |
3.26 |
3.03 - 3.33 |
0.4277 times |
Fri 28 February 2025 |
3.28 (1.55%) |
3.14 |
3.08 - 3.51 |
0.414 times |

DMA SMA EMA moving averages of Lg Display LPL
DMA (daily moving average) of Lg Display LPL
| DMA period | DMA value | | 5 day DMA | 4.37 | | 12 day DMA | 4.31 | | 20 day DMA | 4.4 | | 35 day DMA | 4.67 | | 50 day DMA | 4.83 | | 100 day DMA | 4.48 | | 150 day DMA | 4.07 | | 200 day DMA | 3.82 | EMA (exponential moving average) of Lg Display LPL
| EMA period | EMA current | EMA prev | EMA prev2 | | 5 day EMA | 4.39 | 4.36 | 4.33 | | 12 day EMA | 4.39 | 4.38 | 4.37 | | 20 day EMA | 4.46 | 4.46 | 4.46 | | 35 day EMA | 4.6 | 4.61 | 4.62 | | 50 day EMA | 4.78 | 4.79 | 4.81 |
SMA (simple moving average) of Lg Display LPL
| SMA period | SMA current | SMA prev | SMA prev2 | | 5 day SMA | 4.37 | 4.35 | 4.32 | | 12 day SMA | 4.31 | 4.3 | 4.31 | | 20 day SMA | 4.4 | 4.42 | 4.45 | | 35 day SMA | 4.67 | 4.69 | 4.71 | | 50 day SMA | 4.83 | 4.84 | 4.85 | | 100 day SMA | 4.48 | 4.47 | 4.46 | | 150 day SMA | 4.07 | 4.06 | 4.05 | | 200 day SMA | 3.82 | 3.81 | 3.81 |
|
|
