LindsayCorporation LNN full analysis,charts,indicators,moving averages,SMA,DMA,EMA,ADX,MACD,RSILindsay Corporation LNN WideScreen charts, DMA,SMA,EMA technical analysis, forecast prediction, by indicators ADX,MACD,RSI,CCI NYSE stock exchange
operates under Capital Goods sector & deals in Industrial Machinery Components
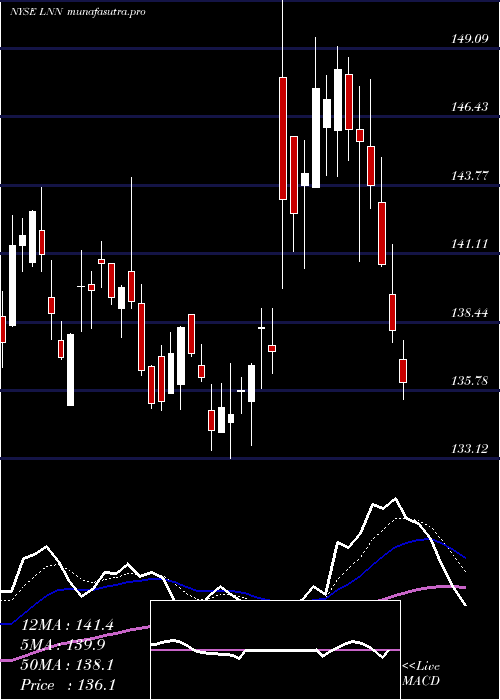
Daily price and charts and targets LindsayCorporation Strong Daily Stock price targets for LindsayCorporation LNN are 117.67 and 119.21 | Daily Target 1 | 116.54 | | Daily Target 2 | 117.26 | | Daily Target 3 | 118.08333333333 | | Daily Target 4 | 118.8 | | Daily Target 5 | 119.62 |
Daily price and volume Lindsay Corporation
| Date |
Closing |
Open |
Range |
Volume |
Thu 04 December 2025 |
117.97 (-0.49%) |
117.94 |
117.37 - 118.91 |
0.7693 times |
Wed 03 December 2025 |
118.55 (1.26%) |
117.93 |
117.05 - 119.13 |
0.6196 times |
Tue 02 December 2025 |
117.08 (0.07%) |
117.03 |
115.97 - 119.96 |
0.9578 times |
Mon 01 December 2025 |
117.00 (1.8%) |
114.75 |
113.52 - 117.35 |
1.2305 times |
Fri 28 November 2025 |
114.93 (-1.31%) |
117.25 |
114.40 - 117.25 |
0.5775 times |
Wed 26 November 2025 |
116.45 (-1.2%) |
116.67 |
116.44 - 119.24 |
1.2345 times |
Tue 25 November 2025 |
117.87 (3.17%) |
114.83 |
114.20 - 117.98 |
1.1396 times |
Mon 24 November 2025 |
114.25 (1.37%) |
112.60 |
112.08 - 115.00 |
1.2779 times |
Fri 21 November 2025 |
112.71 (2.85%) |
109.97 |
109.28 - 113.38 |
1.0146 times |
Thu 20 November 2025 |
109.59 (0.72%) |
109.17 |
107.84 - 113.25 |
1.179 times |
Wed 19 November 2025 |
108.81 (1.01%) |
107.19 |
106.71 - 110.82 |
1.1155 times |
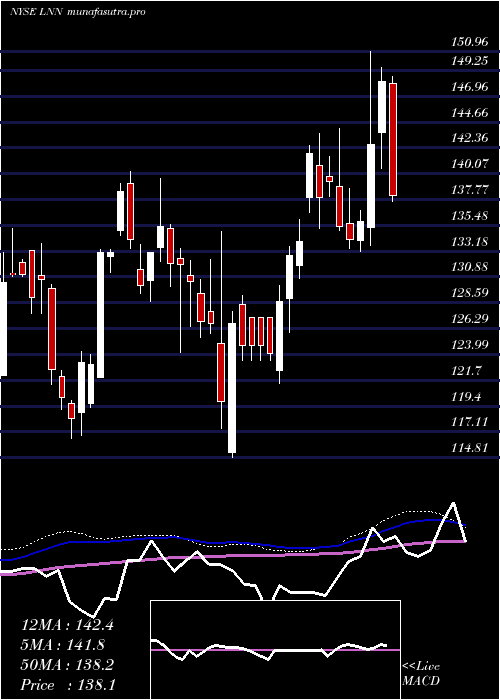
Weekly price and charts LindsayCorporation Strong weekly Stock price targets for LindsayCorporation LNN are 115.75 and 122.19 | Weekly Target 1 | 110.71 | | Weekly Target 2 | 114.34 | | Weekly Target 3 | 117.15 | | Weekly Target 4 | 120.78 | | Weekly Target 5 | 123.59 |
Weekly price and volumes for Lindsay Corporation
| Date |
Closing |
Open |
Range |
Volume |
Thu 04 December 2025 |
117.97 (2.65%) |
114.75 |
113.52 - 119.96 |
0.8289 times |
Fri 28 November 2025 |
114.93 (1.97%) |
112.60 |
112.08 - 119.24 |
0.98 times |
Fri 21 November 2025 |
112.71 (2.4%) |
110.02 |
106.10 - 113.38 |
1.1882 times |
Fri 14 November 2025 |
110.07 (-0.73%) |
111.50 |
109.44 - 114.07 |
0.7649 times |
Fri 07 November 2025 |
110.88 (-0.32%) |
111.57 |
109.27 - 117.98 |
0.9133 times |
Fri 31 October 2025 |
111.24 (0%) |
109.60 |
109.32 - 112.21 |
0.2339 times |
Fri 31 October 2025 |
111.24 (-4.61%) |
116.27 |
108.70 - 117.12 |
1.2948 times |
Fri 24 October 2025 |
116.62 (-10.2%) |
131.54 |
109.87 - 131.54 |
2.5531 times |
Fri 17 October 2025 |
129.87 (-6.68%) |
134.19 |
129.24 - 136.29 |
0.9581 times |
Tue 07 October 2025 |
139.16 (-1.43%) |
141.86 |
139.11 - 142.73 |
0.2849 times |
Fri 03 October 2025 |
141.18 (1.07%) |
140.14 |
138.42 - 143.22 |
0.9184 times |
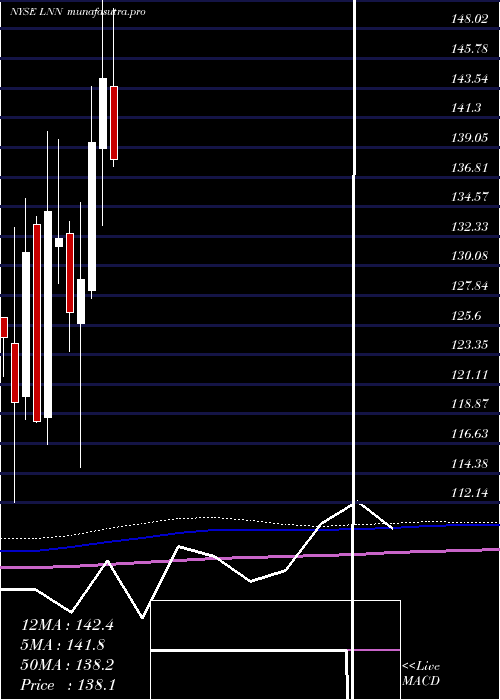
Monthly price and charts LindsayCorporation Strong monthly Stock price targets for LindsayCorporation LNN are 115.75 and 122.19 | Monthly Target 1 | 110.71 | | Monthly Target 2 | 114.34 | | Monthly Target 3 | 117.15 | | Monthly Target 4 | 120.78 | | Monthly Target 5 | 123.59 |
Monthly price and volumes Lindsay Corporation
| Date |
Closing |
Open |
Range |
Volume |
Thu 04 December 2025 |
117.97 (2.65%) |
114.75 |
113.52 - 119.96 |
0.2488 times |
Fri 28 November 2025 |
114.93 (3.32%) |
111.57 |
106.10 - 119.24 |
1.1545 times |
Fri 31 October 2025 |
111.24 (-20.86%) |
139.48 |
108.70 - 143.22 |
1.7597 times |
Tue 30 September 2025 |
140.56 (2.43%) |
136.44 |
135.50 - 142.85 |
0.9754 times |
Fri 29 August 2025 |
137.23 (0.53%) |
135.33 |
132.82 - 143.81 |
0.7844 times |
Thu 31 July 2025 |
136.51 (-5.37%) |
143.70 |
133.48 - 149.55 |
1.6488 times |
Mon 30 June 2025 |
144.25 (3.48%) |
138.98 |
133.12 - 150.96 |
1.0909 times |
Fri 30 May 2025 |
139.40 (8.01%) |
128.22 |
127.59 - 143.69 |
0.7052 times |
Wed 30 April 2025 |
129.06 (2.01%) |
125.70 |
114.81 - 134.90 |
0.9503 times |
Mon 31 March 2025 |
126.52 (-4.24%) |
132.55 |
123.63 - 133.45 |
0.6818 times |
Fri 28 February 2025 |
132.12 (-1.54%) |
131.55 |
128.74 - 139.65 |
0.5903 times |
DMA SMA EMA moving averages of Lindsay Corporation LNN
DMA (daily moving average) of Lindsay Corporation LNN
| DMA period | DMA value | | 5 day DMA | 117.11 | | 12 day DMA | 114.41 | | 20 day DMA | 113.02 | | 35 day DMA | 115.17 | | 50 day DMA | 122.22 | | 100 day DMA | 130.23 | | 150 day DMA | 132.87 | | 200 day DMA | 131.79 | EMA (exponential moving average) of Lindsay Corporation LNN
| EMA period | EMA current | EMA prev | EMA prev2 | | 5 day EMA | 117.23 | 116.86 | 116.02 | | 12 day EMA | 115.51 | 115.06 | 114.43 | | 20 day EMA | 115.38 | 115.11 | 114.75 | | 35 day EMA | 119.03 | 119.09 | 119.12 | | 50 day EMA | 123.17 | 123.38 | 123.58 |
SMA (simple moving average) of Lindsay Corporation LNN
| SMA period | SMA current | SMA prev | SMA prev2 | | 5 day SMA | 117.11 | 116.8 | 116.67 | | 12 day SMA | 114.41 | 113.46 | 112.75 | | 20 day SMA | 113.02 | 112.88 | 112.56 | | 35 day SMA | 115.17 | 115.64 | 116.08 | | 50 day SMA | 122.22 | 122.64 | 123.09 | | 100 day SMA | 130.23 | 130.45 | 130.71 | | 150 day SMA | 132.87 | 132.94 | 133.01 | | 200 day SMA | 131.79 | 131.85 | 131.92 |
|
|
