LennoxInternational LII full analysis,charts,indicators,moving averages,SMA,DMA,EMA,ADX,MACD,RSILennox International LII WideScreen charts, DMA,SMA,EMA technical analysis, forecast prediction, by indicators ADX,MACD,RSI,CCI NYSE stock exchange
operates under Capital Goods sector & deals in Industrial Machinery Components
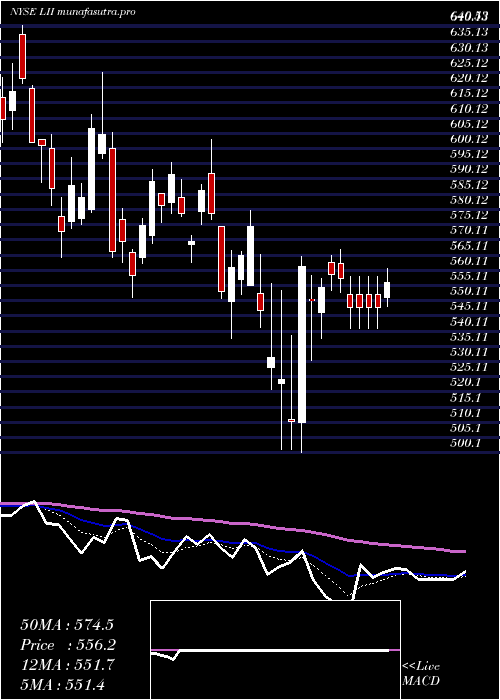
Daily price and charts and targets LennoxInternational Strong Daily Stock price targets for LennoxInternational LII are 530.36 and 542.57 | Daily Target 1 | 520.75 | | Daily Target 2 | 527.75 | | Daily Target 3 | 532.96 | | Daily Target 4 | 539.96 | | Daily Target 5 | 545.17 |
Daily price and volume Lennox International
| Date |
Closing |
Open |
Range |
Volume |
Mon 20 October 2025 |
534.75 (2.26%) |
526.39 |
525.96 - 538.17 |
1.1983 times |
Fri 17 October 2025 |
522.95 (-0.19%) |
520.34 |
516.79 - 525.18 |
1.045 times |
Thu 16 October 2025 |
523.94 (-0.58%) |
530.94 |
520.71 - 530.94 |
1.1646 times |
Wed 15 October 2025 |
526.99 (-0.73%) |
526.39 |
523.13 - 539.01 |
0.9854 times |
Tue 14 October 2025 |
530.84 (1.26%) |
520.22 |
517.37 - 532.04 |
1.0149 times |
Mon 13 October 2025 |
524.25 (-3.28%) |
529.14 |
519.08 - 530.20 |
0.6194 times |
Tue 07 October 2025 |
542.03 (-2.03%) |
553.76 |
534.96 - 554.98 |
1.6435 times |
Mon 06 October 2025 |
553.28 (0.48%) |
559.14 |
545.70 - 559.67 |
0.5561 times |
Fri 03 October 2025 |
550.63 (0.74%) |
544.40 |
538.38 - 554.68 |
1.1423 times |
Thu 02 October 2025 |
546.61 (1.78%) |
537.20 |
534.95 - 551.55 |
0.6306 times |
Wed 01 October 2025 |
537.06 (1.45%) |
528.67 |
524.89 - 537.82 |
1.5791 times |
Weekly price and charts LennoxInternational Strong weekly Stock price targets for LennoxInternational LII are 530.36 and 542.57 | Weekly Target 1 | 520.75 | | Weekly Target 2 | 527.75 | | Weekly Target 3 | 532.96 | | Weekly Target 4 | 539.96 | | Weekly Target 5 | 545.17 |
Weekly price and volumes for Lennox International
| Date |
Closing |
Open |
Range |
Volume |
Mon 20 October 2025 |
534.75 (2.26%) |
526.39 |
525.96 - 538.17 |
0.2917 times |
Fri 17 October 2025 |
522.95 (-3.52%) |
529.14 |
516.79 - 539.01 |
1.1755 times |
Tue 07 October 2025 |
542.03 (-1.56%) |
559.14 |
534.96 - 559.67 |
0.5354 times |
Fri 03 October 2025 |
550.63 (5.5%) |
523.00 |
516.30 - 554.68 |
1.4253 times |
Fri 26 September 2025 |
521.94 (-3.28%) |
538.33 |
510.23 - 538.63 |
1.2008 times |
Fri 19 September 2025 |
539.64 (-0.89%) |
547.51 |
537.37 - 559.73 |
1.4362 times |
Fri 12 September 2025 |
544.48 (-5.81%) |
578.67 |
540.78 - 582.21 |
1.4558 times |
Fri 05 September 2025 |
578.05 (3.62%) |
550.00 |
537.00 - 580.58 |
0.9707 times |
Fri 29 August 2025 |
557.86 (0%) |
561.32 |
553.13 - 564.41 |
0.2078 times |
Fri 29 August 2025 |
557.86 (-5.75%) |
587.45 |
553.13 - 590.99 |
1.3008 times |
Fri 22 August 2025 |
591.92 (0.04%) |
593.65 |
567.14 - 616.50 |
1.5447 times |
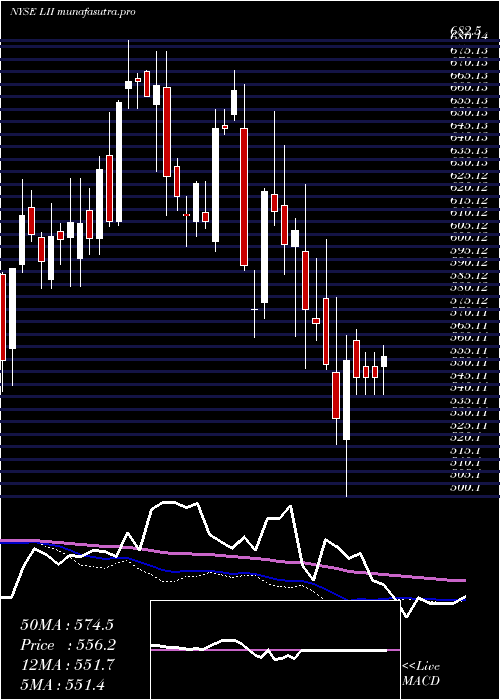
Monthly price and charts LennoxInternational Strong monthly Stock price targets for LennoxInternational LII are 525.77 and 568.65 | Monthly Target 1 | 494.19 | | Monthly Target 2 | 514.47 | | Monthly Target 3 | 537.07 | | Monthly Target 4 | 557.35 | | Monthly Target 5 | 579.95 |
Monthly price and volumes Lennox International
| Date |
Closing |
Open |
Range |
Volume |
Mon 20 October 2025 |
534.75 (1.02%) |
528.67 |
516.79 - 559.67 |
0.542 times |
Tue 30 September 2025 |
529.36 (-5.11%) |
550.00 |
510.23 - 582.21 |
1.0909 times |
Fri 29 August 2025 |
557.86 (-8.4%) |
609.07 |
553.13 - 616.50 |
0.9735 times |
Thu 31 July 2025 |
609.00 (6.24%) |
574.00 |
573.62 - 689.44 |
1.1257 times |
Mon 30 June 2025 |
573.24 (1.56%) |
558.32 |
536.15 - 573.60 |
0.8966 times |
Fri 30 May 2025 |
564.45 (3.24%) |
553.55 |
549.90 - 606.07 |
1.0445 times |
Wed 30 April 2025 |
546.75 (-2.51%) |
557.05 |
500.10 - 579.70 |
1.115 times |
Mon 31 March 2025 |
560.83 (-6.69%) |
600.26 |
537.74 - 624.99 |
1.1829 times |
Fri 28 February 2025 |
601.05 (1.46%) |
575.00 |
563.78 - 654.02 |
0.9577 times |
Fri 31 January 2025 |
592.42 (-2.77%) |
614.78 |
590.67 - 670.46 |
1.0712 times |
Tue 31 December 2024 |
609.30 (-8.55%) |
670.03 |
603.55 - 678.24 |
1.5499 times |

DMA SMA EMA moving averages of Lennox International LII
DMA (daily moving average) of Lennox International LII
| DMA period | DMA value | | 5 day DMA | 527.89 | | 12 day DMA | 535.22 | | 20 day DMA | 532.49 | | 35 day DMA | 543.15 | | 50 day DMA | 556.64 | | 100 day DMA | 572.18 | | 150 day DMA | 569.22 | | 200 day DMA | 580.74 | EMA (exponential moving average) of Lennox International LII
| EMA period | EMA current | EMA prev | EMA prev2 | | 5 day EMA | 529.84 | 527.38 | 529.59 | | 12 day EMA | 532.47 | 532.05 | 533.7 | | 20 day EMA | 536.43 | 536.61 | 538.05 | | 35 day EMA | 546.69 | 547.39 | 548.83 | | 50 day EMA | 557.8 | 558.74 | 560.2 |
SMA (simple moving average) of Lennox International LII
| SMA period | SMA current | SMA prev | SMA prev2 | | 5 day SMA | 527.89 | 525.79 | 529.61 | | 12 day SMA | 535.22 | 534.05 | 533.97 | | 20 day SMA | 532.49 | 533.05 | 534.42 | | 35 day SMA | 543.15 | 544.07 | 545.35 | | 50 day SMA | 556.64 | 557.84 | 559.45 | | 100 day SMA | 572.18 | 572.53 | 573.27 | | 150 day SMA | 569.22 | 569.43 | 569.97 | | 200 day SMA | 580.74 | 581.17 | 581.7 |
|
|
