LaboratoryCorporation LH full analysis,charts,indicators,moving averages,SMA,DMA,EMA,ADX,MACD,RSILaboratory Corporation LH WideScreen charts, DMA,SMA,EMA technical analysis, forecast prediction, by indicators ADX,MACD,RSI,CCI NYSE stock exchange
operates under Health Care sector & deals in Medical Specialities
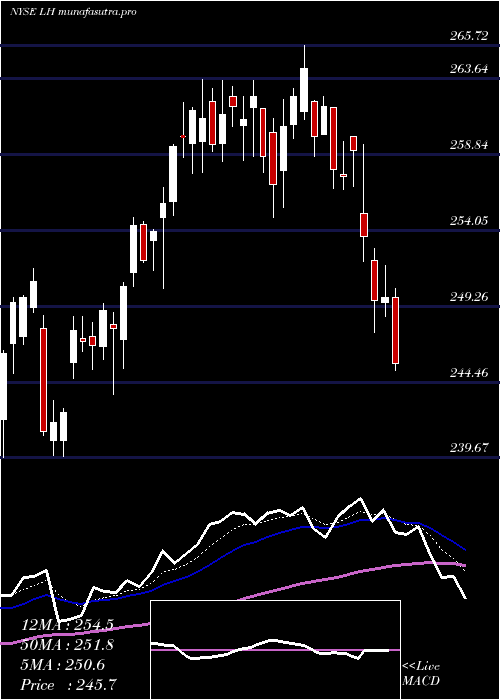
Daily price and charts and targets LaboratoryCorporation Strong Daily Stock price targets for LaboratoryCorporation LH are 255.92 and 260.02 | Daily Target 1 | 255.1 | | Daily Target 2 | 256.74 | | Daily Target 3 | 259.19666666667 | | Daily Target 4 | 260.84 | | Daily Target 5 | 263.3 |
Daily price and volume Laboratory Corporation
| Date |
Closing |
Open |
Range |
Volume |
Fri 05 December 2025 |
258.39 (-1.18%) |
261.45 |
257.55 - 261.65 |
0.8618 times |
Thu 04 December 2025 |
261.48 (-1.61%) |
265.27 |
259.42 - 265.56 |
1.0925 times |
Wed 03 December 2025 |
265.76 (-0.06%) |
266.66 |
265.22 - 268.00 |
0.9001 times |
Tue 02 December 2025 |
265.93 (-0.67%) |
267.56 |
264.66 - 268.15 |
0.8365 times |
Mon 01 December 2025 |
267.73 (-0.39%) |
267.46 |
266.98 - 272.82 |
0.973 times |
Fri 28 November 2025 |
268.78 (0.19%) |
270.05 |
268.10 - 270.52 |
0.3971 times |
Wed 26 November 2025 |
268.27 (-0.58%) |
268.01 |
266.50 - 270.10 |
0.7676 times |
Tue 25 November 2025 |
269.83 (1.7%) |
266.80 |
264.85 - 270.98 |
1.1486 times |
Mon 24 November 2025 |
265.31 (-0.12%) |
268.15 |
262.91 - 268.83 |
1.6381 times |
Fri 21 November 2025 |
265.64 (1.59%) |
262.18 |
261.11 - 269.53 |
1.3848 times |
Thu 20 November 2025 |
261.47 (0.35%) |
262.86 |
260.02 - 264.74 |
0.6279 times |
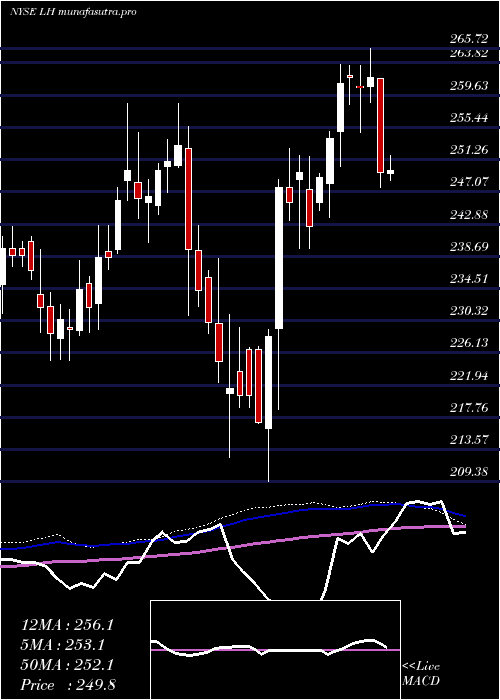
Weekly price and charts LaboratoryCorporation Strong weekly Stock price targets for LaboratoryCorporation LH are 250.34 and 265.61 | Weekly Target 1 | 247.65 | | Weekly Target 2 | 253.02 | | Weekly Target 3 | 262.92 | | Weekly Target 4 | 268.29 | | Weekly Target 5 | 278.19 |
Weekly price and volumes for Laboratory Corporation
| Date |
Closing |
Open |
Range |
Volume |
Fri 05 December 2025 |
258.39 (-3.87%) |
267.46 |
257.55 - 272.82 |
0.9839 times |
Fri 28 November 2025 |
268.78 (1.18%) |
268.15 |
262.91 - 270.98 |
0.8336 times |
Fri 21 November 2025 |
265.64 (-0.47%) |
265.72 |
257.71 - 269.53 |
0.959 times |
Fri 14 November 2025 |
266.89 (5.61%) |
251.57 |
249.93 - 271.00 |
2.0089 times |
Fri 07 November 2025 |
252.72 (-0.49%) |
257.59 |
244.52 - 259.68 |
1.1236 times |
Fri 31 October 2025 |
253.96 (0%) |
251.38 |
249.31 - 256.48 |
0.3707 times |
Fri 31 October 2025 |
253.96 (-9.13%) |
280.36 |
248.00 - 280.36 |
2.1415 times |
Fri 24 October 2025 |
279.49 (-2.26%) |
287.33 |
279.12 - 293.72 |
0.7422 times |
Fri 17 October 2025 |
285.94 (2.26%) |
276.56 |
276.00 - 286.85 |
0.5426 times |
Tue 07 October 2025 |
279.62 (0.97%) |
277.70 |
273.45 - 283.69 |
0.294 times |
Fri 03 October 2025 |
276.94 (-1.31%) |
280.61 |
275.27 - 289.20 |
0.8303 times |
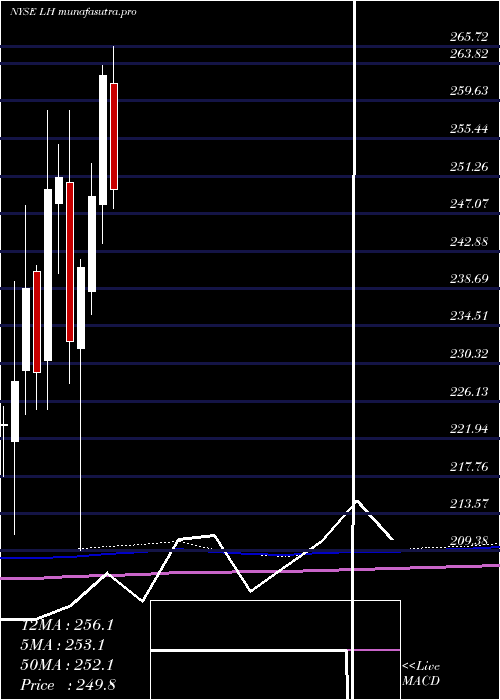
Monthly price and charts LaboratoryCorporation Strong monthly Stock price targets for LaboratoryCorporation LH are 250.34 and 265.61 | Monthly Target 1 | 247.65 | | Monthly Target 2 | 253.02 | | Monthly Target 3 | 262.92 | | Monthly Target 4 | 268.29 | | Monthly Target 5 | 278.19 |
Monthly price and volumes Laboratory Corporation
| Date |
Closing |
Open |
Range |
Volume |
Fri 05 December 2025 |
258.39 (-3.87%) |
267.46 |
257.55 - 272.82 |
0.2626 times |
Fri 28 November 2025 |
268.78 (5.84%) |
257.59 |
244.52 - 271.00 |
1.3145 times |
Fri 31 October 2025 |
253.96 (-11.53%) |
287.42 |
248.00 - 293.72 |
1.2379 times |
Tue 30 September 2025 |
287.06 (3.26%) |
275.97 |
270.00 - 288.36 |
0.7036 times |
Fri 29 August 2025 |
277.99 (6.89%) |
259.59 |
256.69 - 280.28 |
0.7237 times |
Thu 31 July 2025 |
260.08 (-0.93%) |
261.55 |
241.81 - 283.47 |
1.3426 times |
Mon 30 June 2025 |
262.51 (5.44%) |
248.11 |
243.71 - 263.60 |
0.928 times |
Fri 30 May 2025 |
248.97 (3.3%) |
238.36 |
235.81 - 252.68 |
1.1033 times |
Wed 30 April 2025 |
241.01 (3.55%) |
231.96 |
209.38 - 241.95 |
1.4085 times |
Mon 31 March 2025 |
232.74 (-7.29%) |
250.50 |
228.11 - 258.59 |
0.9753 times |
Fri 28 February 2025 |
251.04 (0.5%) |
248.22 |
240.42 - 254.79 |
0.7987 times |
DMA SMA EMA moving averages of Laboratory Corporation LH
DMA (daily moving average) of Laboratory Corporation LH
| DMA period | DMA value | | 5 day DMA | 263.86 | | 12 day DMA | 264.93 | | 20 day DMA | 264.16 | | 35 day DMA | 265.25 | | 50 day DMA | 269.65 | | 100 day DMA | 268.94 | | 150 day DMA | 263.45 | | 200 day DMA | 256.69 | EMA (exponential moving average) of Laboratory Corporation LH
| EMA period | EMA current | EMA prev | EMA prev2 | | 5 day EMA | 262.7 | 264.86 | 266.55 | | 12 day EMA | 264.02 | 265.04 | 265.69 | | 20 day EMA | 264.43 | 265.06 | 265.44 | | 35 day EMA | 267.36 | 267.89 | 268.27 | | 50 day EMA | 269.62 | 270.08 | 270.43 |
SMA (simple moving average) of Laboratory Corporation LH
| SMA period | SMA current | SMA prev | SMA prev2 | | 5 day SMA | 263.86 | 265.94 | 267.29 | | 12 day SMA | 264.93 | 265.05 | 265.04 | | 20 day SMA | 264.16 | 263.57 | 263.03 | | 35 day SMA | 265.25 | 265.98 | 266.58 | | 50 day SMA | 269.65 | 270.06 | 270.38 | | 100 day SMA | 268.94 | 268.86 | 268.78 | | 150 day SMA | 263.45 | 263.26 | 263.04 | | 200 day SMA | 256.69 | 256.6 | 256.52 |
|
|
