LennarCorporation LEN.B full analysis,charts,indicators,moving averages,SMA,DMA,EMA,ADX,MACD,RSILennar Corporation LEN.B WideScreen charts, DMA,SMA,EMA technical analysis, forecast prediction, by indicators ADX,MACD,RSI,CCI NYSE stock exchange
operates under Basic Industries sector & deals in Homebuilding
Daily price and charts and targets LennarCorporation Strong Daily Stock price targets for LennarCorporation LEN.B are 111.39 and 113.24 | Daily Target 1 | 110.03 | | Daily Target 2 | 110.89 | | Daily Target 3 | 111.88 | | Daily Target 4 | 112.74 | | Daily Target 5 | 113.73 |
Daily price and volume Lennar Corporation
| Date |
Closing |
Open |
Range |
Volume |
Mon 28 July 2025 |
111.75 (0.83%) |
111.34 |
111.02 - 112.87 |
1.5694 times |
Fri 25 July 2025 |
110.83 (1.88%) |
110.15 |
108.01 - 111.19 |
0.8059 times |
Thu 24 July 2025 |
108.79 (-3.44%) |
111.82 |
108.51 - 111.82 |
0.9608 times |
Wed 23 July 2025 |
112.67 (-0.64%) |
114.70 |
111.65 - 114.70 |
0.8481 times |
Tue 22 July 2025 |
113.40 (9.17%) |
106.35 |
106.35 - 114.07 |
1.5779 times |
Mon 21 July 2025 |
103.87 (-0.75%) |
105.92 |
103.87 - 105.92 |
0.7185 times |
Fri 18 July 2025 |
104.66 (-0.26%) |
105.39 |
103.63 - 105.39 |
1.0087 times |
Thu 17 July 2025 |
104.93 (0.07%) |
104.04 |
104.04 - 105.28 |
0.5974 times |
Wed 16 July 2025 |
104.86 (2.22%) |
103.51 |
102.79 - 104.86 |
1.1552 times |
Tue 15 July 2025 |
102.58 (-4.47%) |
107.96 |
102.58 - 108.12 |
0.758 times |
Mon 14 July 2025 |
107.38 (-1.28%) |
108.45 |
105.79 - 108.45 |
0.6593 times |
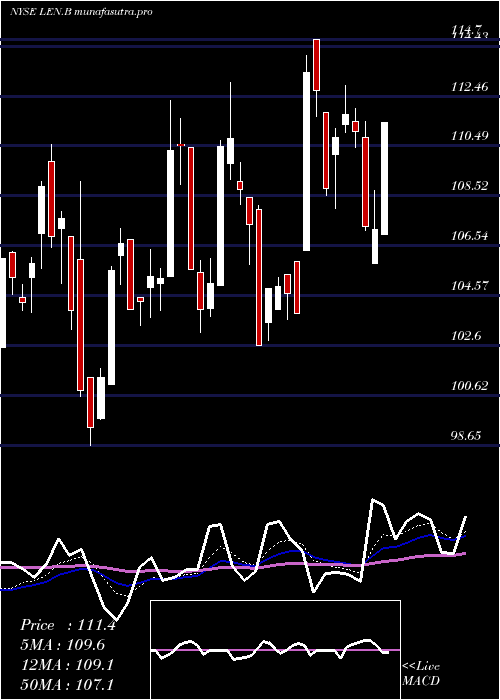
Weekly price and charts LennarCorporation Strong weekly Stock price targets for LennarCorporation LEN.B are 111.39 and 113.24 | Weekly Target 1 | 110.03 | | Weekly Target 2 | 110.89 | | Weekly Target 3 | 111.88 | | Weekly Target 4 | 112.74 | | Weekly Target 5 | 113.73 |
Weekly price and volumes for Lennar Corporation
| Date |
Closing |
Open |
Range |
Volume |
Mon 28 July 2025 |
111.75 (0.83%) |
111.34 |
111.02 - 112.87 |
0.3014 times |
Fri 25 July 2025 |
110.83 (5.9%) |
105.92 |
103.87 - 114.70 |
0.9432 times |
Fri 18 July 2025 |
104.66 (-3.78%) |
108.45 |
102.58 - 108.45 |
0.8025 times |
Fri 11 July 2025 |
108.77 (2.98%) |
105.48 |
103.10 - 113.01 |
1.2208 times |
Thu 03 July 2025 |
105.62 (0.28%) |
105.07 |
103.99 - 112.31 |
1.1797 times |
Fri 27 June 2025 |
105.32 (3.93%) |
101.06 |
101.06 - 107.23 |
1.4606 times |
Fri 20 June 2025 |
101.34 (-2.55%) |
106.00 |
98.65 - 109.10 |
0.9963 times |
Fri 13 June 2025 |
103.99 (-0.31%) |
105.27 |
103.24 - 110.55 |
1.1429 times |
Fri 06 June 2025 |
104.31 (2.97%) |
100.78 |
98.16 - 106.33 |
1.0985 times |
Fri 30 May 2025 |
101.30 (0.49%) |
101.51 |
100.38 - 103.86 |
0.8539 times |
Fri 23 May 2025 |
100.81 (-7.09%) |
106.71 |
99.00 - 107.55 |
1.4498 times |

Monthly price and charts LennarCorporation Strong monthly Stock price targets for LennarCorporation LEN.B are 107.17 and 119.29 | Monthly Target 1 | 97.56 | | Monthly Target 2 | 104.65 | | Monthly Target 3 | 109.67666666667 | | Monthly Target 4 | 116.77 | | Monthly Target 5 | 121.8 |
Monthly price and volumes Lennar Corporation
| Date |
Closing |
Open |
Range |
Volume |
Mon 28 July 2025 |
111.75 (6.18%) |
105.31 |
102.58 - 114.70 |
0.6719 times |
Mon 30 June 2025 |
105.25 (3.9%) |
100.78 |
98.16 - 110.55 |
0.782 times |
Fri 30 May 2025 |
101.30 (-2%) |
103.48 |
99.00 - 109.25 |
1.0831 times |
Wed 30 April 2025 |
103.37 (-5.23%) |
109.46 |
94.09 - 109.75 |
1.0727 times |
Mon 31 March 2025 |
109.07 (-5.73%) |
115.81 |
105.57 - 123.53 |
0.9914 times |
Fri 28 February 2025 |
115.70 (-8.02%) |
124.49 |
114.19 - 124.73 |
1.3375 times |
Fri 31 January 2025 |
125.79 (-4.81%) |
132.97 |
123.19 - 137.54 |
1.7189 times |
Tue 31 December 2024 |
132.15 (-19.23%) |
164.72 |
130.03 - 164.82 |
0.8417 times |
Tue 26 November 2024 |
163.62 (2.06%) |
159.96 |
155.10 - 170.50 |
0.6904 times |
Thu 31 October 2024 |
160.32 (-7.3%) |
172.24 |
152.17 - 177.00 |
0.8103 times |
Mon 30 September 2024 |
172.94 (2.43%) |
169.00 |
160.00 - 176.65 |
0.6785 times |

DMA SMA EMA moving averages of Lennar Corporation LEN.B
DMA (daily moving average) of Lennar Corporation LEN.B
| DMA period | DMA value | | 5 day DMA | 111.49 | | 12 day DMA | 107.87 | | 20 day DMA | 107.83 | | 35 day DMA | 106.48 | | 50 day DMA | 105.54 | | 100 day DMA | 105.96 | | 150 day DMA | 112.55 | | 200 day DMA | 124.7 | EMA (exponential moving average) of Lennar Corporation LEN.B
| EMA period | EMA current | EMA prev | EMA prev2 | | 5 day EMA | 110.38 | 109.7 | 109.14 | | 12 day EMA | 108.85 | 108.32 | 107.86 | | 20 day EMA | 107.93 | 107.53 | 107.18 | | 35 day EMA | 106.9 | 106.61 | 106.36 | | 50 day EMA | 106.08 | 105.85 | 105.65 |
SMA (simple moving average) of Lennar Corporation LEN.B
| SMA period | SMA current | SMA prev | SMA prev2 | | 5 day SMA | 111.49 | 109.91 | 108.68 | | 12 day SMA | 107.87 | 107.79 | 107.77 | | 20 day SMA | 107.83 | 107.5 | 107.18 | | 35 day SMA | 106.48 | 106.31 | 106.06 | | 50 day SMA | 105.54 | 105.46 | 105.39 | | 100 day SMA | 105.96 | 105.98 | 106.03 | | 150 day SMA | 112.55 | 112.74 | 112.97 | | 200 day SMA | 124.7 | 124.98 | 125.28 |
|
|
