LearCorporation LEA full analysis,charts,indicators,moving averages,SMA,DMA,EMA,ADX,MACD,RSILear Corporation LEA WideScreen charts, DMA,SMA,EMA technical analysis, forecast prediction, by indicators ADX,MACD,RSI,CCI NYSE stock exchange
operates under Capital Goods sector & deals in Auto Parts O E M
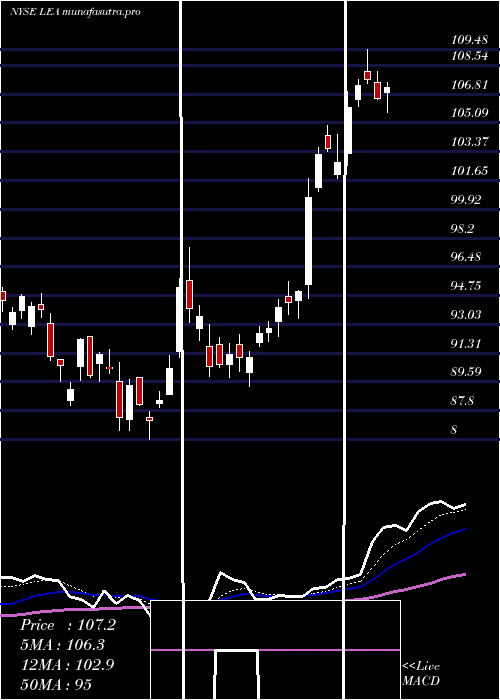
Daily price and charts and targets LearCorporation Strong Daily Stock price targets for LearCorporation LEA are 106.44 and 109.03 | Daily Target 1 | 105.99 | | Daily Target 2 | 106.88 | | Daily Target 3 | 108.57666666667 | | Daily Target 4 | 109.47 | | Daily Target 5 | 111.17 |
Daily price and volume Lear Corporation
| Date |
Closing |
Open |
Range |
Volume |
Fri 05 December 2025 |
107.78 (-1.06%) |
108.99 |
107.68 - 110.27 |
0.6755 times |
Thu 04 December 2025 |
108.94 (-0.32%) |
109.41 |
108.19 - 110.00 |
1.2721 times |
Wed 03 December 2025 |
109.29 (1.33%) |
108.00 |
107.97 - 109.90 |
1.1529 times |
Tue 02 December 2025 |
107.86 (-0.33%) |
108.25 |
106.15 - 109.04 |
1.6082 times |
Mon 01 December 2025 |
108.22 (0.8%) |
107.15 |
106.79 - 109.77 |
1.135 times |
Fri 28 November 2025 |
107.36 (-0.38%) |
107.98 |
107.04 - 108.77 |
1.0969 times |
Wed 26 November 2025 |
107.77 (-0.53%) |
107.43 |
107.02 - 109.80 |
0.8079 times |
Tue 25 November 2025 |
108.34 (3.3%) |
105.86 |
105.45 - 109.06 |
0.6117 times |
Mon 24 November 2025 |
104.88 (0.7%) |
104.29 |
103.50 - 105.64 |
0.7793 times |
Fri 21 November 2025 |
104.15 (4.91%) |
100.21 |
100.21 - 104.63 |
0.8604 times |
Thu 20 November 2025 |
99.28 (-3.34%) |
103.14 |
99.00 - 104.69 |
0.6563 times |
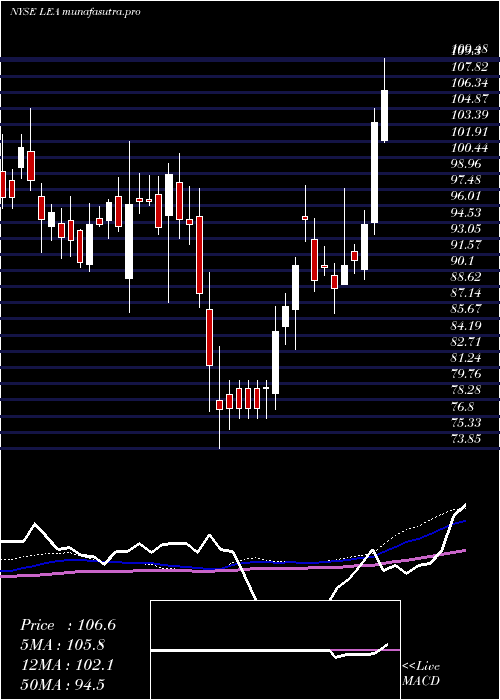
Weekly price and charts LearCorporation Strong weekly Stock price targets for LearCorporation LEA are 106.97 and 111.09 | Weekly Target 1 | 103.95 | | Weekly Target 2 | 105.86 | | Weekly Target 3 | 108.06666666667 | | Weekly Target 4 | 109.98 | | Weekly Target 5 | 112.19 |
Weekly price and volumes for Lear Corporation
| Date |
Closing |
Open |
Range |
Volume |
Fri 05 December 2025 |
107.78 (0.39%) |
107.15 |
106.15 - 110.27 |
1.488 times |
Fri 28 November 2025 |
107.36 (3.08%) |
104.29 |
103.50 - 109.80 |
0.8392 times |
Fri 21 November 2025 |
104.15 (-1.77%) |
105.36 |
99.00 - 105.36 |
1.0504 times |
Fri 14 November 2025 |
106.03 (-3.72%) |
110.59 |
105.37 - 110.66 |
1.1021 times |
Fri 07 November 2025 |
110.13 (5.24%) |
106.97 |
105.38 - 110.94 |
1.0586 times |
Fri 31 October 2025 |
104.65 (0%) |
106.05 |
99.12 - 110.88 |
0.3906 times |
Fri 31 October 2025 |
104.65 (2.69%) |
102.26 |
99.12 - 110.88 |
1.4128 times |
Fri 24 October 2025 |
101.91 (2.46%) |
100.06 |
99.01 - 102.44 |
0.7867 times |
Fri 17 October 2025 |
99.46 (2.77%) |
97.73 |
96.04 - 101.46 |
0.9943 times |
Fri 10 October 2025 |
96.78 (-6.93%) |
104.25 |
96.44 - 104.63 |
0.8773 times |
Fri 03 October 2025 |
103.99 (2.51%) |
102.00 |
99.14 - 104.00 |
1.1481 times |
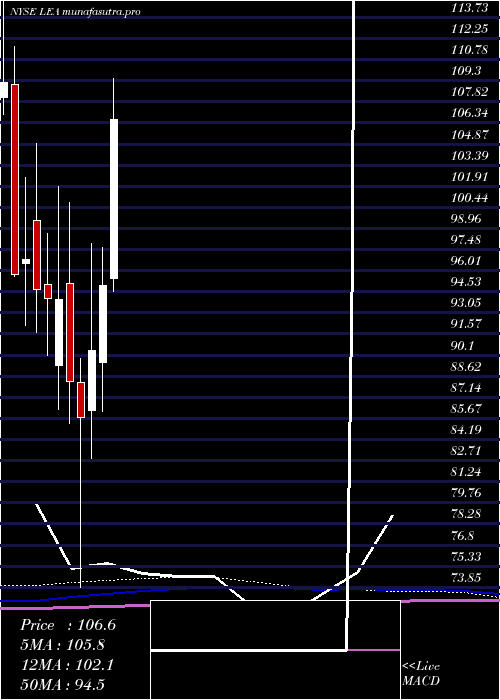
Monthly price and charts LearCorporation Strong monthly Stock price targets for LearCorporation LEA are 106.97 and 111.09 | Monthly Target 1 | 103.95 | | Monthly Target 2 | 105.86 | | Monthly Target 3 | 108.06666666667 | | Monthly Target 4 | 109.98 | | Monthly Target 5 | 112.19 |
Monthly price and volumes Lear Corporation
| Date |
Closing |
Open |
Range |
Volume |
Fri 05 December 2025 |
107.78 (0.39%) |
107.15 |
106.15 - 110.27 |
0.3132 times |
Fri 28 November 2025 |
107.36 (2.59%) |
106.97 |
99.00 - 110.94 |
0.8524 times |
Fri 31 October 2025 |
104.65 (4.02%) |
100.31 |
96.04 - 110.88 |
1.0773 times |
Tue 30 September 2025 |
100.61 (-8.54%) |
108.60 |
98.85 - 113.10 |
1.2532 times |
Fri 29 August 2025 |
110.00 (16.66%) |
93.45 |
91.67 - 111.00 |
0.7843 times |
Thu 31 July 2025 |
94.29 (-0.73%) |
95.45 |
93.35 - 109.48 |
1.2573 times |
Mon 30 June 2025 |
94.98 (5.04%) |
89.60 |
86.14 - 97.62 |
1.0715 times |
Fri 30 May 2025 |
90.42 (5.45%) |
86.21 |
82.88 - 97.88 |
1.0184 times |
Wed 30 April 2025 |
85.75 (-2.8%) |
88.19 |
73.85 - 89.88 |
1.0548 times |
Mon 31 March 2025 |
88.22 (-6.14%) |
95.10 |
85.29 - 100.79 |
1.3175 times |
Fri 28 February 2025 |
93.99 (-0.11%) |
89.39 |
86.28 - 101.90 |
1.0627 times |
DMA SMA EMA moving averages of Lear Corporation LEA
DMA (daily moving average) of Lear Corporation LEA
| DMA period | DMA value | | 5 day DMA | 108.42 | | 12 day DMA | 106.38 | | 20 day DMA | 106.6 | | 35 day DMA | 105.15 | | 50 day DMA | 103.75 | | 100 day DMA | 103.92 | | 150 day DMA | 100.72 | | 200 day DMA | 97.54 | EMA (exponential moving average) of Lear Corporation LEA
| EMA period | EMA current | EMA prev | EMA prev2 | | 5 day EMA | 108.13 | 108.3 | 107.98 | | 12 day EMA | 107.23 | 107.13 | 106.8 | | 20 day EMA | 106.51 | 106.38 | 106.11 | | 35 day EMA | 105.23 | 105.08 | 104.85 | | 50 day EMA | 104.13 | 103.98 | 103.78 |
SMA (simple moving average) of Lear Corporation LEA
| SMA period | SMA current | SMA prev | SMA prev2 | | 5 day SMA | 108.42 | 108.33 | 108.1 | | 12 day SMA | 106.38 | 105.95 | 105.36 | | 20 day SMA | 106.6 | 106.63 | 106.64 | | 35 day SMA | 105.15 | 104.94 | 104.69 | | 50 day SMA | 103.75 | 103.6 | 103.45 | | 100 day SMA | 103.92 | 103.91 | 103.87 | | 150 day SMA | 100.72 | 100.57 | 100.42 | | 200 day SMA | 97.54 | 97.49 | 97.43 |
|
|
