LciIndustries LCII full analysis,charts,indicators,moving averages,SMA,DMA,EMA,ADX,MACD,RSILci Industries LCII WideScreen charts, DMA,SMA,EMA technical analysis, forecast prediction, by indicators ADX,MACD,RSI,CCI NYSE stock exchange
operates under Capital Goods sector & deals in Auto Parts O E M
Daily price and charts and targets LciIndustries Strong Daily Stock price targets for LciIndustries LCII are 113.08 and 115.3 | Daily Target 1 | 112.55 | | Daily Target 2 | 113.61 | | Daily Target 3 | 114.77333333333 | | Daily Target 4 | 115.83 | | Daily Target 5 | 116.99 |
Daily price and volume Lci Industries
| Date |
Closing |
Open |
Range |
Volume |
Fri 05 December 2025 |
114.66 (-0.3%) |
114.73 |
113.72 - 115.94 |
1.0202 times |
Thu 04 December 2025 |
115.00 (0.39%) |
114.33 |
113.20 - 115.96 |
0.7794 times |
Wed 03 December 2025 |
114.55 (-2.02%) |
117.45 |
114.43 - 118.26 |
0.6748 times |
Tue 02 December 2025 |
116.91 (2.29%) |
114.94 |
113.65 - 117.14 |
0.6972 times |
Mon 01 December 2025 |
114.29 (0.55%) |
113.05 |
112.68 - 116.74 |
0.8303 times |
Fri 28 November 2025 |
113.67 (-1.77%) |
114.56 |
113.47 - 115.02 |
0.667 times |
Wed 26 November 2025 |
115.72 (-0.91%) |
116.15 |
115.57 - 118.00 |
1.2049 times |
Tue 25 November 2025 |
116.78 (3.99%) |
113.35 |
113.35 - 117.27 |
1.2565 times |
Mon 24 November 2025 |
112.30 (0.23%) |
111.11 |
110.14 - 113.26 |
1.0427 times |
Fri 21 November 2025 |
112.04 (5.32%) |
107.06 |
106.90 - 113.30 |
1.827 times |
Thu 20 November 2025 |
106.38 (-0.3%) |
106.70 |
104.80 - 108.48 |
0.7587 times |
Weekly price and charts LciIndustries Strong weekly Stock price targets for LciIndustries LCII are 113.67 and 119.25 | Weekly Target 1 | 109.62 | | Weekly Target 2 | 112.14 | | Weekly Target 3 | 115.2 | | Weekly Target 4 | 117.72 | | Weekly Target 5 | 120.78 |
Weekly price and volumes for Lci Industries
| Date |
Closing |
Open |
Range |
Volume |
Fri 05 December 2025 |
114.66 (0.87%) |
113.05 |
112.68 - 118.26 |
0.848 times |
Fri 28 November 2025 |
113.67 (1.45%) |
111.11 |
110.14 - 118.00 |
0.8838 times |
Fri 21 November 2025 |
112.04 (4.78%) |
107.35 |
103.68 - 113.30 |
1.1618 times |
Fri 14 November 2025 |
106.93 (-1.62%) |
110.95 |
105.50 - 111.96 |
1.2152 times |
Fri 07 November 2025 |
108.69 (5.02%) |
106.69 |
104.81 - 110.70 |
1.1392 times |
Fri 31 October 2025 |
103.49 (0%) |
97.11 |
96.16 - 103.65 |
0.5557 times |
Fri 31 October 2025 |
103.49 (12.44%) |
92.14 |
88.36 - 103.65 |
2.3448 times |
Fri 24 October 2025 |
92.04 (4.42%) |
88.63 |
88.14 - 92.93 |
0.6941 times |
Fri 17 October 2025 |
88.14 (-1.12%) |
86.32 |
84.33 - 88.65 |
0.8219 times |
Tue 07 October 2025 |
89.14 (-5.58%) |
94.44 |
88.60 - 94.44 |
0.3355 times |
Fri 03 October 2025 |
94.41 (-0.67%) |
95.29 |
91.75 - 95.68 |
0.651 times |
Monthly price and charts LciIndustries Strong monthly Stock price targets for LciIndustries LCII are 113.67 and 119.25 | Monthly Target 1 | 109.62 | | Monthly Target 2 | 112.14 | | Monthly Target 3 | 115.2 | | Monthly Target 4 | 117.72 | | Monthly Target 5 | 120.78 |
Monthly price and volumes Lci Industries
| Date |
Closing |
Open |
Range |
Volume |
Fri 05 December 2025 |
114.66 (0.87%) |
113.05 |
112.68 - 118.26 |
0.1629 times |
Fri 28 November 2025 |
113.67 (9.84%) |
106.69 |
103.68 - 118.00 |
0.8453 times |
Fri 31 October 2025 |
103.49 (11.1%) |
92.54 |
84.33 - 103.65 |
0.9799 times |
Tue 30 September 2025 |
93.15 (-11.64%) |
104.14 |
92.15 - 108.47 |
0.8044 times |
Fri 29 August 2025 |
105.42 (10.97%) |
93.75 |
92.43 - 108.98 |
0.8794 times |
Thu 31 July 2025 |
95.00 (4.18%) |
90.62 |
90.47 - 102.72 |
1.0203 times |
Mon 30 June 2025 |
91.19 (4.65%) |
86.69 |
84.25 - 93.26 |
0.9651 times |
Fri 30 May 2025 |
87.14 (13.05%) |
77.43 |
76.59 - 93.20 |
1.2373 times |
Wed 30 April 2025 |
77.08 (-11.84%) |
86.90 |
72.31 - 90.54 |
1.4845 times |
Mon 31 March 2025 |
87.43 (-15.79%) |
104.75 |
85.69 - 106.28 |
1.6207 times |
Fri 28 February 2025 |
103.82 (-0.93%) |
102.22 |
99.59 - 112.00 |
0.8387 times |

DMA SMA EMA moving averages of Lci Industries LCII
DMA (daily moving average) of Lci Industries LCII
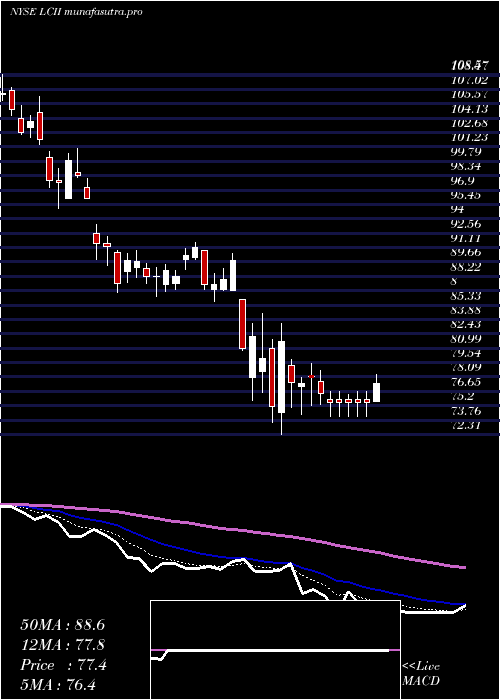
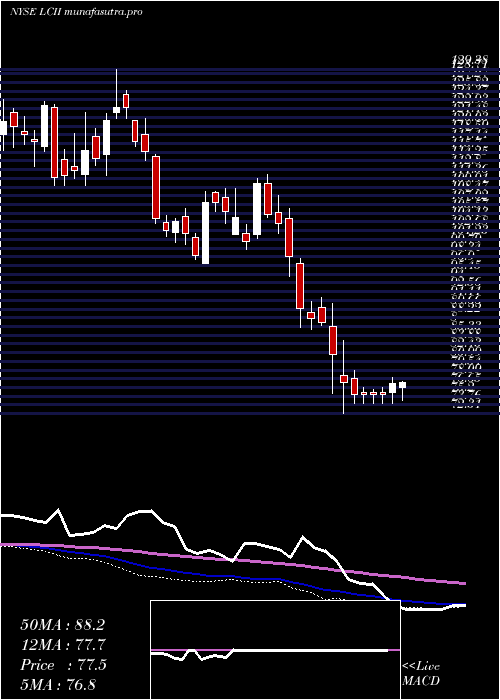
| DMA period | DMA value | | 5 day DMA | 115.08 | | 12 day DMA | 113.25 | | 20 day DMA | 111.22 | | 35 day DMA | 104.82 | | 50 day DMA | 100.91 | | 100 day DMA | 100.87 | | 150 day DMA | 97.07 | | 200 day DMA | 95.02 | EMA (exponential moving average) of Lci Industries LCII
| EMA period | EMA current | EMA prev | EMA prev2 | | 5 day EMA | 114.75 | 114.8 | 114.7 | | 12 day EMA | 113.15 | 112.87 | 112.48 | | 20 day EMA | 110.8 | 110.39 | 109.9 | | 35 day EMA | 106.57 | 106.09 | 105.57 | | 50 day EMA | 102.11 | 101.6 | 101.05 |
SMA (simple moving average) of Lci Industries LCII
| SMA period | SMA current | SMA prev | SMA prev2 | | 5 day SMA | 115.08 | 114.88 | 115.03 | | 12 day SMA | 113.25 | 112.57 | 111.73 | | 20 day SMA | 111.22 | 110.88 | 110.66 | | 35 day SMA | 104.82 | 104.04 | 103.24 | | 50 day SMA | 100.91 | 100.56 | 100.21 | | 100 day SMA | 100.87 | 100.72 | 100.58 | | 150 day SMA | 97.07 | 96.83 | 96.59 | | 200 day SMA | 95.02 | 95 | 94.97 |
|
|
