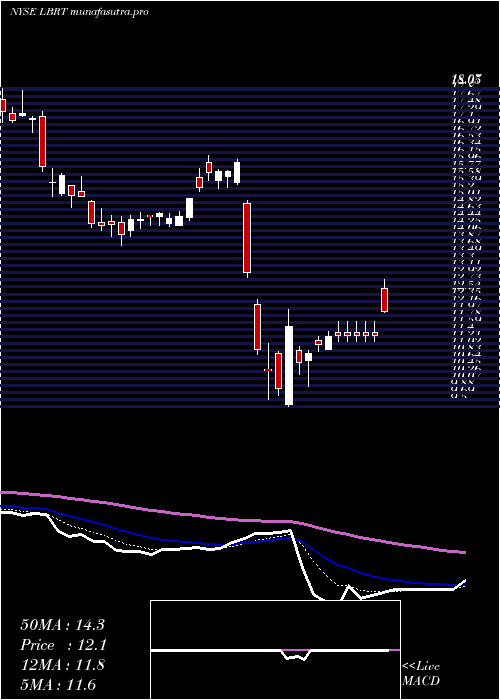
LibertyOilfield LBRT full analysis,charts,indicators,moving averages,SMA,DMA,EMA,ADX,MACD,RSILiberty Oilfield LBRT WideScreen charts, DMA,SMA,EMA technical analysis, forecast prediction, by indicators ADX,MACD,RSI,CCI NYSE stock exchange
operates under Energy sector & deals in Oilfield Services Equipment
Daily price and charts and targets LibertyOilfield Strong Daily Stock price targets for LibertyOilfield LBRT are 19.28 and 20.23 | Daily Target 1 | 18.51 | | Daily Target 2 | 19.1 | | Daily Target 3 | 19.463333333333 | | Daily Target 4 | 20.05 | | Daily Target 5 | 20.41 |
Daily price and volume Liberty Oilfield
| Date |
Closing |
Open |
Range |
Volume |
Thu 04 December 2025 |
19.68 (2.61%) |
19.15 |
18.88 - 19.83 |
0.5602 times |
Wed 03 December 2025 |
19.18 (2.79%) |
18.66 |
18.60 - 19.66 |
0.8688 times |
Tue 02 December 2025 |
18.66 (2.53%) |
18.20 |
18.01 - 18.85 |
0.8906 times |
Mon 01 December 2025 |
18.20 (2.36%) |
17.80 |
17.68 - 18.44 |
0.8401 times |
Fri 28 November 2025 |
17.78 (0.28%) |
17.81 |
17.51 - 18.07 |
0.5115 times |
Wed 26 November 2025 |
17.73 (0.45%) |
17.48 |
17.32 - 18.09 |
1.0826 times |
Tue 25 November 2025 |
17.65 (2.92%) |
17.07 |
16.72 - 17.78 |
1.0905 times |
Mon 24 November 2025 |
17.15 (4.57%) |
16.22 |
16.07 - 17.19 |
1.1538 times |
Fri 21 November 2025 |
16.40 (1.3%) |
16.10 |
15.70 - 16.58 |
1.2594 times |
Thu 20 November 2025 |
16.19 (-3.97%) |
17.14 |
16.10 - 17.78 |
1.7425 times |
Wed 19 November 2025 |
16.86 (2.74%) |
16.10 |
15.87 - 16.90 |
1.5811 times |
Weekly price and charts LibertyOilfield Strong weekly Stock price targets for LibertyOilfield LBRT are 18.68 and 20.83 | Weekly Target 1 | 16.91 | | Weekly Target 2 | 18.3 | | Weekly Target 3 | 19.063333333333 | | Weekly Target 4 | 20.45 | | Weekly Target 5 | 21.21 |
Weekly price and volumes for Liberty Oilfield
| Date |
Closing |
Open |
Range |
Volume |
Thu 04 December 2025 |
19.68 (10.69%) |
17.80 |
17.68 - 19.83 |
0.4235 times |
Fri 28 November 2025 |
17.78 (8.41%) |
16.22 |
16.07 - 18.09 |
0.5145 times |
Fri 21 November 2025 |
16.40 (3.02%) |
15.90 |
15.65 - 17.78 |
0.949 times |
Fri 14 November 2025 |
15.92 (-7.39%) |
17.55 |
14.76 - 17.73 |
1.0158 times |
Fri 07 November 2025 |
17.19 (-5.08%) |
17.78 |
16.63 - 18.13 |
0.6525 times |
Fri 31 October 2025 |
18.11 (0%) |
18.79 |
17.97 - 18.79 |
0.2009 times |
Fri 31 October 2025 |
18.11 (10.43%) |
17.15 |
16.43 - 19.20 |
1.4783 times |
Fri 24 October 2025 |
16.40 (7.05%) |
15.43 |
14.79 - 17.06 |
1.7282 times |
Fri 17 October 2025 |
15.32 (20.63%) |
13.22 |
11.52 - 15.65 |
2.2259 times |
Fri 03 October 2025 |
12.70 (-0.31%) |
12.63 |
12.05 - 13.10 |
0.8113 times |
Fri 26 September 2025 |
12.74 (16.35%) |
10.80 |
10.69 - 13.05 |
1.2708 times |

Monthly price and charts LibertyOilfield Strong monthly Stock price targets for LibertyOilfield LBRT are 18.68 and 20.83 | Monthly Target 1 | 16.91 | | Monthly Target 2 | 18.3 | | Monthly Target 3 | 19.063333333333 | | Monthly Target 4 | 20.45 | | Monthly Target 5 | 21.21 |
Monthly price and volumes Liberty Oilfield
| Date |
Closing |
Open |
Range |
Volume |
Thu 04 December 2025 |
19.68 (10.69%) |
17.80 |
17.68 - 19.83 |
0.1221 times |
Fri 28 November 2025 |
17.78 (-1.82%) |
17.78 |
14.76 - 18.13 |
0.9027 times |
Fri 31 October 2025 |
18.11 (46.76%) |
12.28 |
11.52 - 19.20 |
1.748 times |
Tue 30 September 2025 |
12.34 (9.69%) |
11.17 |
9.90 - 13.05 |
1.3718 times |
Fri 29 August 2025 |
11.25 (-8.83%) |
12.10 |
10.47 - 12.18 |
0.785 times |
Thu 31 July 2025 |
12.34 (7.49%) |
11.49 |
10.96 - 14.00 |
1.3857 times |
Mon 30 June 2025 |
11.48 (-0.95%) |
11.97 |
11.26 - 13.79 |
0.8319 times |
Fri 30 May 2025 |
11.59 (0.78%) |
11.57 |
10.94 - 13.35 |
0.7889 times |
Wed 30 April 2025 |
11.50 (-27.35%) |
15.70 |
9.50 - 16.15 |
1.0937 times |
Mon 31 March 2025 |
15.83 (-8.34%) |
17.33 |
13.86 - 17.45 |
0.9701 times |
Fri 28 February 2025 |
17.27 (-5.68%) |
18.19 |
16.89 - 18.76 |
0.9055 times |

DMA SMA EMA moving averages of Liberty Oilfield LBRT
DMA (daily moving average) of Liberty Oilfield LBRT
| DMA period | DMA value | | 5 day DMA | 18.7 | | 12 day DMA | 17.66 | | 20 day DMA | 17.22 | | 35 day DMA | 16.96 | | 50 day DMA | 15.57 | | 100 day DMA | 13.49 | | 150 day DMA | 13.04 | | 200 day DMA | 13.38 | EMA (exponential moving average) of Liberty Oilfield LBRT
| EMA period | EMA current | EMA prev | EMA prev2 | | 5 day EMA | 18.82 | 18.39 | 18 | | 12 day EMA | 18 | 17.7 | 17.43 | | 20 day EMA | 17.47 | 17.24 | 17.04 | | 35 day EMA | 16.37 | 16.18 | 16 | | 50 day EMA | 15.51 | 15.34 | 15.18 |
SMA (simple moving average) of Liberty Oilfield LBRT
| SMA period | SMA current | SMA prev | SMA prev2 | | 5 day SMA | 18.7 | 18.31 | 18 | | 12 day SMA | 17.66 | 17.36 | 17.09 | | 20 day SMA | 17.22 | 17.11 | 17 | | 35 day SMA | 16.96 | 16.75 | 16.57 | | 50 day SMA | 15.57 | 15.39 | 15.23 | | 100 day SMA | 13.49 | 13.42 | 13.34 | | 150 day SMA | 13.04 | 12.98 | 12.93 | | 200 day SMA | 13.38 | 13.37 | 13.36 |
|
|
