LBrands LB full analysis,charts,indicators,moving averages,SMA,DMA,EMA,ADX,MACD,RSIL Brands LB WideScreen charts, DMA,SMA,EMA technical analysis, forecast prediction, by indicators ADX,MACD,RSI,CCI NYSE stock exchange
operates under Consumer Services sector & deals in Clothing Shoe Accessory Stores
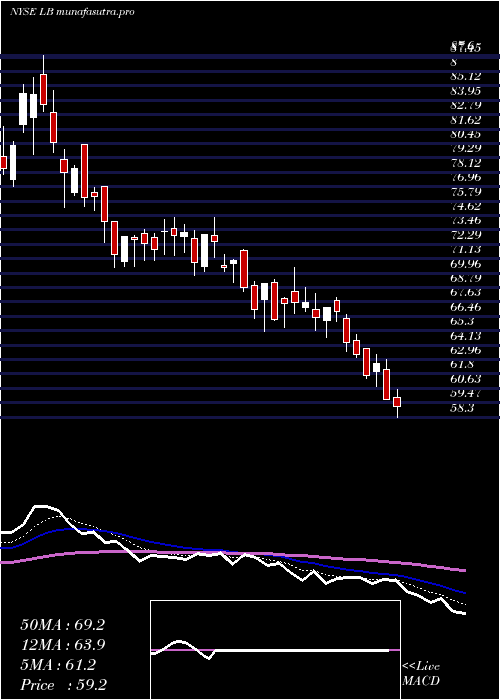
Daily price and charts and targets LBrands Strong Daily Stock price targets for LBrands LB are 58.21 and 59.97 | Daily Target 1 | 57.83 | | Daily Target 2 | 58.59 | | Daily Target 3 | 59.59 | | Daily Target 4 | 60.35 | | Daily Target 5 | 61.35 |
Daily price and volume L Brands
| Date |
Closing |
Open |
Range |
Volume |
Thu 04 December 2025 |
59.35 (-1.9%) |
60.25 |
58.83 - 60.59 |
0.6622 times |
Wed 03 December 2025 |
60.50 (9.62%) |
55.25 |
54.88 - 60.70 |
1.4222 times |
Tue 02 December 2025 |
55.19 (-1.04%) |
56.61 |
54.72 - 57.00 |
0.8297 times |
Mon 01 December 2025 |
55.77 (-2.07%) |
56.00 |
54.84 - 56.46 |
0.609 times |
Fri 28 November 2025 |
56.95 (0.25%) |
57.79 |
56.79 - 58.00 |
0.5193 times |
Wed 26 November 2025 |
56.81 (1.27%) |
55.06 |
55.06 - 58.18 |
1.1083 times |
Tue 25 November 2025 |
56.10 (-1.02%) |
56.25 |
54.16 - 56.26 |
1.059 times |
Mon 24 November 2025 |
56.68 (-1.27%) |
58.37 |
55.62 - 58.37 |
1.3843 times |
Fri 21 November 2025 |
57.41 (-3.9%) |
58.25 |
57.00 - 59.94 |
1.0246 times |
Thu 20 November 2025 |
59.74 (-7.58%) |
66.32 |
59.07 - 66.50 |
1.3815 times |
Wed 19 November 2025 |
64.64 (4.24%) |
61.66 |
61.05 - 64.85 |
2.0588 times |
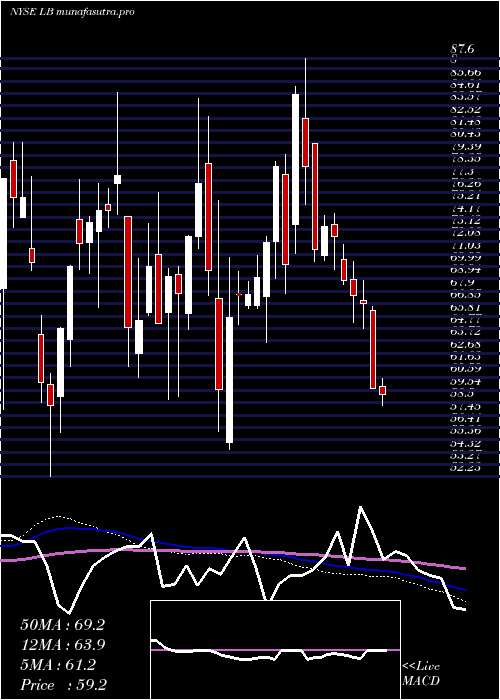
Weekly price and charts LBrands Strong weekly Stock price targets for LBrands LB are 57.04 and 63.02 | Weekly Target 1 | 52.28 | | Weekly Target 2 | 55.81 | | Weekly Target 3 | 58.256666666667 | | Weekly Target 4 | 61.79 | | Weekly Target 5 | 64.24 |
Weekly price and volumes for L Brands
| Date |
Closing |
Open |
Range |
Volume |
Thu 04 December 2025 |
59.35 (4.21%) |
56.00 |
54.72 - 60.70 |
0.6581 times |
Fri 28 November 2025 |
56.95 (-0.8%) |
58.37 |
54.16 - 58.37 |
0.7604 times |
Fri 21 November 2025 |
57.41 (-22.98%) |
70.44 |
56.42 - 70.50 |
2.5103 times |
Fri 14 November 2025 |
74.54 (7.78%) |
69.85 |
69.78 - 85.60 |
1.4471 times |
Fri 07 November 2025 |
69.16 (16.88%) |
60.00 |
58.32 - 69.42 |
0.7506 times |
Fri 31 October 2025 |
59.17 (0%) |
59.26 |
58.51 - 60.15 |
0.1445 times |
Fri 31 October 2025 |
59.17 (-0.6%) |
59.55 |
58.51 - 61.58 |
0.7941 times |
Fri 24 October 2025 |
59.53 (10.16%) |
54.75 |
54.11 - 60.40 |
0.8248 times |
Fri 17 October 2025 |
54.04 (10.6%) |
49.40 |
49.35 - 54.97 |
1.0531 times |
Fri 10 October 2025 |
48.86 (-13.78%) |
56.70 |
48.78 - 57.92 |
1.057 times |
Fri 03 October 2025 |
56.67 (3.89%) |
55.10 |
51.85 - 57.28 |
1.3111 times |
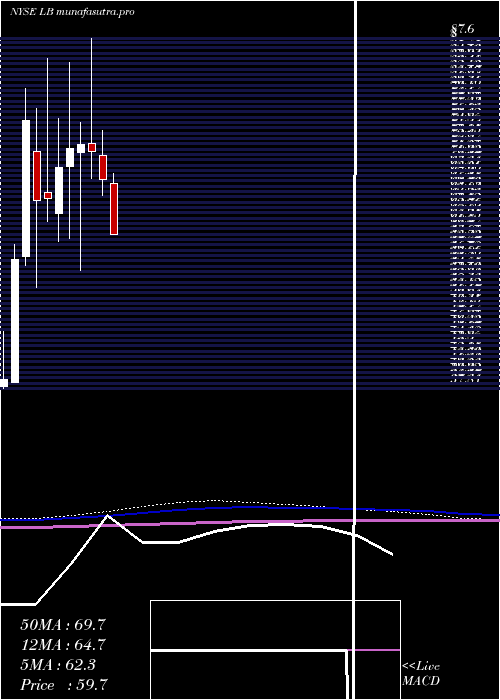
Monthly price and charts LBrands Strong monthly Stock price targets for LBrands LB are 57.04 and 63.02 | Monthly Target 1 | 52.28 | | Monthly Target 2 | 55.81 | | Monthly Target 3 | 58.256666666667 | | Monthly Target 4 | 61.79 | | Monthly Target 5 | 64.24 |
Monthly price and volumes L Brands
| Date |
Closing |
Open |
Range |
Volume |
Thu 04 December 2025 |
59.35 (4.21%) |
56.00 |
54.72 - 60.70 |
0.1274 times |
Fri 28 November 2025 |
56.95 (-3.75%) |
60.00 |
54.16 - 85.60 |
1.0584 times |
Fri 31 October 2025 |
59.17 (10.91%) |
52.48 |
48.78 - 61.58 |
0.8923 times |
Tue 30 September 2025 |
53.35 (0.38%) |
52.56 |
50.72 - 61.03 |
0.8862 times |
Fri 29 August 2025 |
53.15 (-6.23%) |
55.99 |
50.50 - 60.53 |
1.1763 times |
Thu 31 July 2025 |
56.68 (-16.13%) |
67.01 |
48.55 - 68.30 |
1.738 times |
Mon 30 June 2025 |
67.58 (-5.42%) |
70.90 |
65.24 - 74.48 |
0.8185 times |
Fri 30 May 2025 |
71.45 (-1.38%) |
72.63 |
67.69 - 87.60 |
0.9438 times |
Wed 30 April 2025 |
72.45 (0.71%) |
71.42 |
54.54 - 75.56 |
1.0622 times |
Mon 31 March 2025 |
71.94 (3.99%) |
69.37 |
59.06 - 84.21 |
1.2969 times |
Fri 28 February 2025 |
69.18 (6.64%) |
62.68 |
58.77 - 76.22 |
1.1464 times |
DMA SMA EMA moving averages of L Brands LB
DMA (daily moving average) of L Brands LB
| DMA period | DMA value | | 5 day DMA | 57.55 | | 12 day DMA | 58.43 | | 20 day DMA | 64.41 | | 35 day DMA | 61.76 | | 50 day DMA | 59.39 | | 100 day DMA | 56.51 | | 150 day DMA | 61.63 | | 200 day DMA | 63.52 | EMA (exponential moving average) of L Brands LB
| EMA period | EMA current | EMA prev | EMA prev2 | | 5 day EMA | 58.32 | 57.81 | 56.47 | | 12 day EMA | 59.51 | 59.54 | 59.36 | | 20 day EMA | 60.54 | 60.67 | 60.69 | | 35 day EMA | 60.19 | 60.24 | 60.22 | | 50 day EMA | 58.74 | 58.72 | 58.65 |
SMA (simple moving average) of L Brands LB
| SMA period | SMA current | SMA prev | SMA prev2 | | 5 day SMA | 57.55 | 57.04 | 56.16 | | 12 day SMA | 58.43 | 58.64 | 59.81 | | 20 day SMA | 64.41 | 64.5 | 64.43 | | 35 day SMA | 61.76 | 61.58 | 61.33 | | 50 day SMA | 59.39 | 59.29 | 59.23 | | 100 day SMA | 56.51 | 56.49 | 56.47 | | 150 day SMA | 61.63 | 61.71 | 61.8 | | 200 day SMA | 63.52 | 63.57 | 63.62 |
|
|
