KennedyWilson KW full analysis,charts,indicators,moving averages,SMA,DMA,EMA,ADX,MACD,RSIKennedy Wilson KW WideScreen charts, DMA,SMA,EMA technical analysis, forecast prediction, by indicators ADX,MACD,RSI,CCI NYSE stock exchange
operates under Finance sector & deals in Real Estate
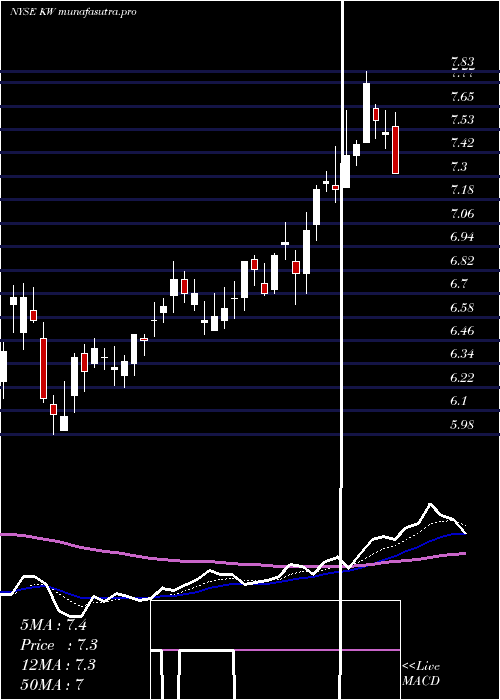
Daily price and charts and targets KennedyWilson Strong Daily Stock price targets for KennedyWilson KW are 9.64 and 9.72 | Daily Target 1 | 9.62 | | Daily Target 2 | 9.66 | | Daily Target 3 | 9.7 | | Daily Target 4 | 9.74 | | Daily Target 5 | 9.78 |
Daily price and volume Kennedy Wilson
| Date |
Closing |
Open |
Range |
Volume |
Fri 05 December 2025 |
9.70 (0.1%) |
9.71 |
9.66 - 9.74 |
0.7369 times |
Thu 04 December 2025 |
9.69 (-0.72%) |
9.75 |
9.69 - 9.78 |
0.7155 times |
Wed 03 December 2025 |
9.76 (0.31%) |
9.77 |
9.70 - 9.82 |
0.8155 times |
Tue 02 December 2025 |
9.73 (-0.41%) |
9.82 |
9.72 - 9.82 |
0.5904 times |
Mon 01 December 2025 |
9.77 (0.41%) |
9.66 |
9.66 - 9.84 |
0.9828 times |
Fri 28 November 2025 |
9.73 (-0.71%) |
9.80 |
9.70 - 9.83 |
0.5925 times |
Wed 26 November 2025 |
9.80 (0.72%) |
9.70 |
9.70 - 9.87 |
1.3377 times |
Tue 25 November 2025 |
9.73 (1.14%) |
9.69 |
9.69 - 9.94 |
1.5941 times |
Mon 24 November 2025 |
9.62 (-2.34%) |
9.84 |
9.57 - 9.85 |
1.5324 times |
Fri 21 November 2025 |
9.85 (3.14%) |
9.64 |
9.55 - 9.89 |
1.1023 times |
Thu 20 November 2025 |
9.55 (0.84%) |
9.65 |
9.53 - 9.69 |
1.2513 times |
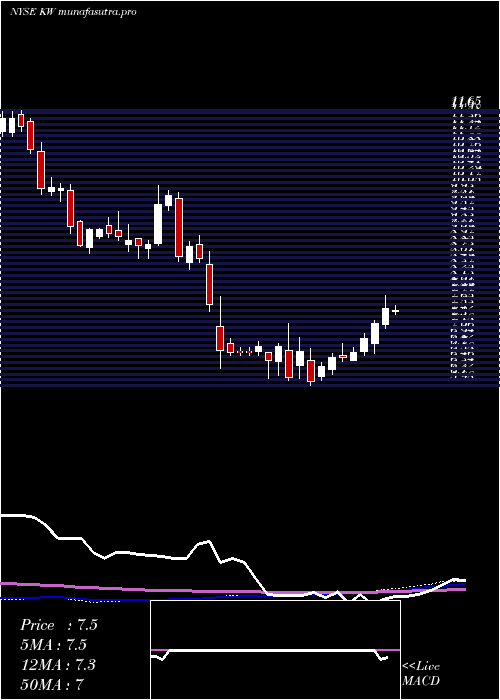
Weekly price and charts KennedyWilson Strong weekly Stock price targets for KennedyWilson KW are 9.68 and 9.86 | Weekly Target 1 | 9.55 | | Weekly Target 2 | 9.63 | | Weekly Target 3 | 9.7333333333333 | | Weekly Target 4 | 9.81 | | Weekly Target 5 | 9.91 |
Weekly price and volumes for Kennedy Wilson
| Date |
Closing |
Open |
Range |
Volume |
Fri 05 December 2025 |
9.70 (-0.31%) |
9.66 |
9.66 - 9.84 |
0.9713 times |
Fri 28 November 2025 |
9.73 (-1.22%) |
9.84 |
9.57 - 9.94 |
1.2788 times |
Fri 21 November 2025 |
9.85 (2.28%) |
9.62 |
9.45 - 9.89 |
1.2386 times |
Fri 14 November 2025 |
9.63 (2.45%) |
9.45 |
9.44 - 9.74 |
1.4228 times |
Fri 07 November 2025 |
9.40 (24.34%) |
7.35 |
7.35 - 9.89 |
2.1965 times |
Fri 31 October 2025 |
7.56 (0%) |
7.47 |
7.40 - 7.58 |
0.2498 times |
Fri 31 October 2025 |
7.56 (-6.78%) |
8.16 |
7.36 - 8.16 |
0.8956 times |
Fri 24 October 2025 |
8.11 (3.31%) |
7.95 |
7.65 - 8.15 |
0.687 times |
Fri 17 October 2025 |
7.85 (0.13%) |
7.50 |
7.47 - 7.89 |
0.7509 times |
Tue 07 October 2025 |
7.84 (-6.33%) |
8.38 |
7.76 - 8.45 |
0.3087 times |
Fri 03 October 2025 |
8.37 (-0.12%) |
8.38 |
8.17 - 8.70 |
0.8619 times |
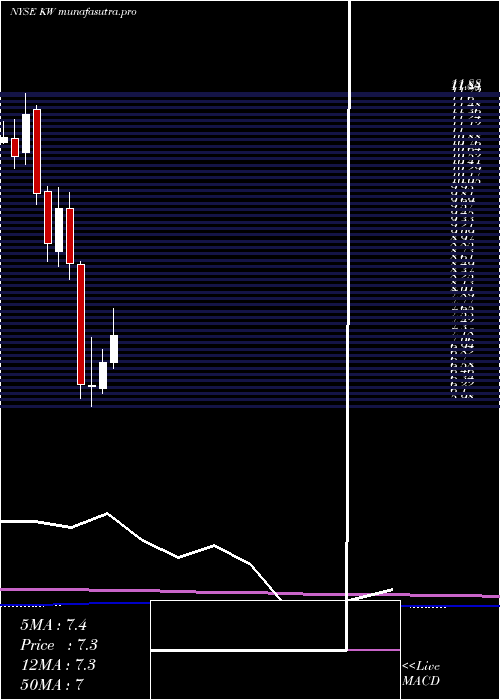
Monthly price and charts KennedyWilson Strong monthly Stock price targets for KennedyWilson KW are 9.68 and 9.86 | Monthly Target 1 | 9.55 | | Monthly Target 2 | 9.63 | | Monthly Target 3 | 9.7333333333333 | | Monthly Target 4 | 9.81 | | Monthly Target 5 | 9.91 |
Monthly price and volumes Kennedy Wilson
| Date |
Closing |
Open |
Range |
Volume |
Fri 05 December 2025 |
9.70 (-0.31%) |
9.66 |
9.66 - 9.84 |
0.2333 times |
Fri 28 November 2025 |
9.73 (28.7%) |
7.35 |
7.35 - 9.94 |
1.4742 times |
Fri 31 October 2025 |
7.56 (-9.13%) |
8.25 |
7.36 - 8.70 |
0.8021 times |
Tue 30 September 2025 |
8.32 (-5.45%) |
8.69 |
8.17 - 9.16 |
0.9353 times |
Fri 29 August 2025 |
8.80 (20.22%) |
7.30 |
6.88 - 8.84 |
0.9708 times |
Thu 31 July 2025 |
7.32 (7.65%) |
6.80 |
6.70 - 7.83 |
1.0432 times |
Mon 30 June 2025 |
6.80 (6.75%) |
6.31 |
6.22 - 7.06 |
1.2464 times |
Fri 30 May 2025 |
6.37 (-0.47%) |
6.35 |
5.98 - 7.27 |
1.4589 times |
Wed 30 April 2025 |
6.40 (-26.27%) |
8.65 |
6.13 - 8.70 |
0.9771 times |
Mon 31 March 2025 |
8.68 (-10.61%) |
9.70 |
8.37 - 10.00 |
0.8586 times |
Fri 28 February 2025 |
9.71 (7.29%) |
8.89 |
8.61 - 10.11 |
0.6015 times |
DMA SMA EMA moving averages of Kennedy Wilson KW
DMA (daily moving average) of Kennedy Wilson KW
| DMA period | DMA value | | 5 day DMA | 9.73 | | 12 day DMA | 9.7 | | 20 day DMA | 9.64 | | 35 day DMA | 8.95 | | 50 day DMA | 8.7 | | 100 day DMA | 8.41 | | 150 day DMA | 7.83 | | 200 day DMA | 7.92 | EMA (exponential moving average) of Kennedy Wilson KW
| EMA period | EMA current | EMA prev | EMA prev2 | | 5 day EMA | 9.72 | 9.73 | 9.75 | | 12 day EMA | 9.64 | 9.63 | 9.62 | | 20 day EMA | 9.47 | 9.45 | 9.43 | | 35 day EMA | 9.19 | 9.16 | 9.13 | | 50 day EMA | 8.81 | 8.77 | 8.73 |
SMA (simple moving average) of Kennedy Wilson KW
| SMA period | SMA current | SMA prev | SMA prev2 | | 5 day SMA | 9.73 | 9.74 | 9.76 | | 12 day SMA | 9.7 | 9.68 | 9.67 | | 20 day SMA | 9.64 | 9.64 | 9.64 | | 35 day SMA | 8.95 | 8.89 | 8.84 | | 50 day SMA | 8.7 | 8.68 | 8.66 | | 100 day SMA | 8.41 | 8.39 | 8.37 | | 150 day SMA | 7.83 | 7.8 | 7.78 | | 200 day SMA | 7.92 | 7.92 | 7.91 |
|
|
