CocaCola KO full analysis,charts,indicators,moving averages,SMA,DMA,EMA,ADX,MACD,RSICoca Cola KO WideScreen charts, DMA,SMA,EMA technical analysis, forecast prediction, by indicators ADX,MACD,RSI,CCI NYSE stock exchange
operates under Consumer Non Durables sector & deals in Beverages Production Distribution
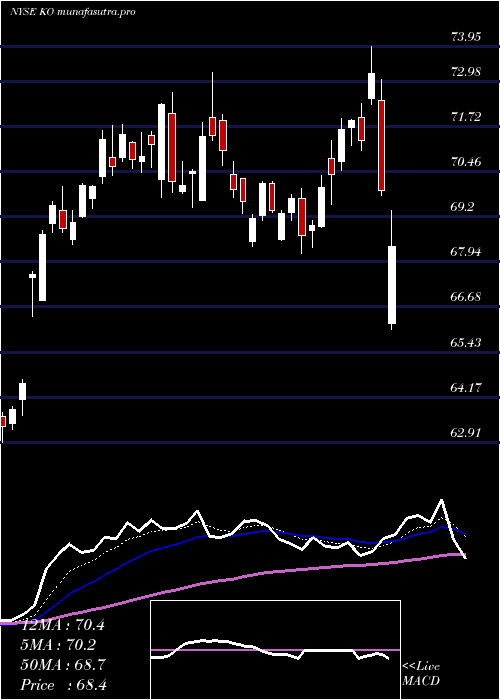
Daily price and charts and targets CocaCola Strong Daily Stock price targets for CocaCola KO are 69.93 and 70.9 | Daily Target 1 | 69.75 | | Daily Target 2 | 70.11 | | Daily Target 3 | 70.723333333333 | | Daily Target 4 | 71.08 | | Daily Target 5 | 71.69 |
Daily price and volume Coca Cola
| Date |
Closing |
Open |
Range |
Volume |
Thu 04 December 2025 |
70.46 (-0.49%) |
70.84 |
70.37 - 71.34 |
0.4807 times |
Wed 03 December 2025 |
70.81 (0.21%) |
70.88 |
70.61 - 71.40 |
1.0423 times |
Tue 02 December 2025 |
70.66 (-1.79%) |
71.91 |
70.43 - 71.99 |
0.705 times |
Mon 01 December 2025 |
71.95 (-1.6%) |
72.60 |
71.93 - 72.90 |
0.882 times |
Fri 28 November 2025 |
73.12 (0.33%) |
73.00 |
72.76 - 73.23 |
0.4551 times |
Wed 26 November 2025 |
72.88 (0.37%) |
72.64 |
72.39 - 73.09 |
0.3586 times |
Tue 25 November 2025 |
72.61 (0.03%) |
72.80 |
72.14 - 72.93 |
1.0698 times |
Mon 24 November 2025 |
72.59 (-0.49%) |
73.16 |
71.57 - 73.16 |
2.441 times |
Fri 21 November 2025 |
72.95 (2.44%) |
71.68 |
71.49 - 73.19 |
1.6216 times |
Thu 20 November 2025 |
71.21 (0.14%) |
70.95 |
70.61 - 71.48 |
0.9439 times |
Wed 19 November 2025 |
71.11 (-0.18%) |
71.20 |
70.81 - 71.45 |
0.7603 times |
Weekly price and charts CocaCola Strong weekly Stock price targets for CocaCola KO are 69.15 and 71.68 | Weekly Target 1 | 68.71 | | Weekly Target 2 | 69.59 | | Weekly Target 3 | 71.243333333333 | | Weekly Target 4 | 72.12 | | Weekly Target 5 | 73.77 |
Weekly price and volumes for Coca Cola
| Date |
Closing |
Open |
Range |
Volume |
Thu 04 December 2025 |
70.46 (-3.64%) |
72.60 |
70.37 - 72.90 |
0.8887 times |
Fri 28 November 2025 |
73.12 (0.23%) |
73.16 |
71.57 - 73.23 |
1.2357 times |
Fri 21 November 2025 |
72.95 (2.52%) |
71.20 |
70.54 - 73.19 |
1.3493 times |
Fri 14 November 2025 |
71.16 (0.86%) |
70.01 |
69.44 - 71.89 |
1.0809 times |
Fri 07 November 2025 |
70.55 (2.39%) |
68.06 |
67.92 - 70.87 |
0.8301 times |
Fri 31 October 2025 |
68.90 (0%) |
68.54 |
67.90 - 69.07 |
0.2933 times |
Fri 31 October 2025 |
68.90 (-1.18%) |
69.78 |
67.90 - 70.90 |
1.3631 times |
Fri 24 October 2025 |
69.72 (1.87%) |
68.42 |
67.92 - 71.62 |
1.2784 times |
Fri 17 October 2025 |
68.44 (2.47%) |
66.23 |
66.00 - 68.50 |
1.2327 times |
Tue 07 October 2025 |
66.79 (0.16%) |
66.80 |
65.84 - 67.26 |
0.4479 times |
Fri 03 October 2025 |
66.68 (1.54%) |
65.67 |
65.35 - 66.99 |
1.1508 times |
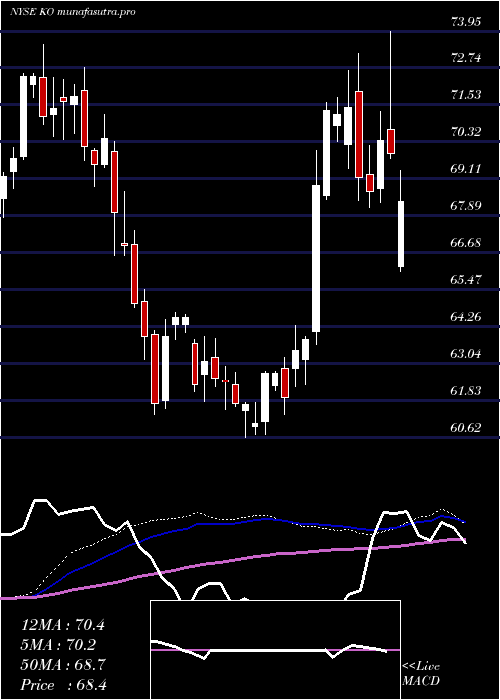
Monthly price and charts CocaCola Strong monthly Stock price targets for CocaCola KO are 69.15 and 71.68 | Monthly Target 1 | 68.71 | | Monthly Target 2 | 69.59 | | Monthly Target 3 | 71.243333333333 | | Monthly Target 4 | 72.12 | | Monthly Target 5 | 73.77 |
Monthly price and volumes Coca Cola
| Date |
Closing |
Open |
Range |
Volume |
Thu 04 December 2025 |
70.46 (-3.64%) |
72.60 |
70.37 - 72.90 |
0.1675 times |
Fri 28 November 2025 |
73.12 (6.12%) |
68.06 |
67.92 - 73.23 |
0.8475 times |
Fri 31 October 2025 |
68.90 (3.89%) |
66.50 |
65.84 - 71.62 |
0.9924 times |
Tue 30 September 2025 |
66.32 (-3.87%) |
68.96 |
65.35 - 69.46 |
1.2862 times |
Fri 29 August 2025 |
68.99 (1.62%) |
68.60 |
68.27 - 71.71 |
0.9088 times |
Thu 31 July 2025 |
67.89 (-4.04%) |
70.99 |
67.74 - 72.45 |
1.1833 times |
Mon 30 June 2025 |
70.75 (-1.87%) |
72.03 |
68.78 - 72.69 |
1.0128 times |
Fri 30 May 2025 |
72.10 (-0.62%) |
72.00 |
68.58 - 72.68 |
1.0068 times |
Wed 30 April 2025 |
72.55 (1.3%) |
71.68 |
66.05 - 74.38 |
1.293 times |
Mon 31 March 2025 |
71.62 (0.58%) |
70.24 |
68.18 - 73.22 |
1.3018 times |
Fri 28 February 2025 |
71.21 (12.18%) |
63.18 |
62.35 - 71.77 |
1.1429 times |
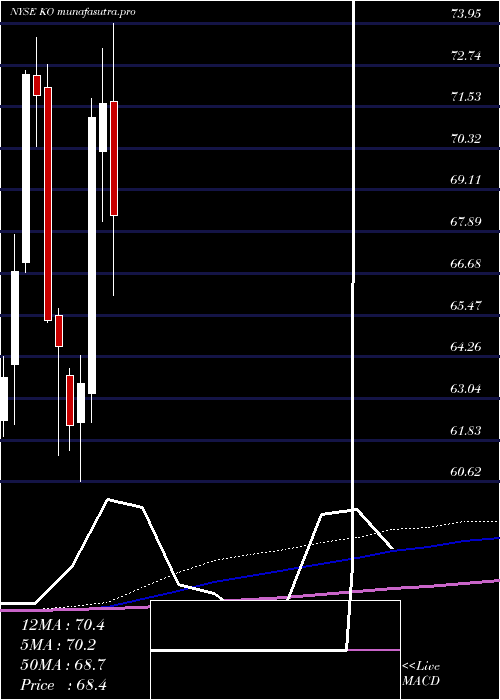
DMA SMA EMA moving averages of Coca Cola KO
DMA (daily moving average) of Coca Cola KO
| DMA period | DMA value | | 5 day DMA | 71.4 | | 12 day DMA | 71.8 | | 20 day DMA | 71.39 | | 35 day DMA | 70.47 | | 50 day DMA | 69.28 | | 100 day DMA | 69.11 | | 150 day DMA | 69.75 | | 200 day DMA | 70.01 | EMA (exponential moving average) of Coca Cola KO
| EMA period | EMA current | EMA prev | EMA prev2 | | 5 day EMA | 71.15 | 71.49 | 71.83 | | 12 day EMA | 71.42 | 71.59 | 71.73 | | 20 day EMA | 71.13 | 71.2 | 71.24 | | 35 day EMA | 70.28 | 70.27 | 70.24 | | 50 day EMA | 69.25 | 69.2 | 69.13 |
SMA (simple moving average) of Coca Cola KO
| SMA period | SMA current | SMA prev | SMA prev2 | | 5 day SMA | 71.4 | 71.88 | 72.24 | | 12 day SMA | 71.8 | 71.82 | 71.85 | | 20 day SMA | 71.39 | 71.29 | 71.19 | | 35 day SMA | 70.47 | 70.37 | 70.28 | | 50 day SMA | 69.28 | 69.19 | 69.11 | | 100 day SMA | 69.11 | 69.1 | 69.09 | | 150 day SMA | 69.75 | 69.76 | 69.77 | | 200 day SMA | 70.01 | 70.01 | 70 |
|
|
