KkrCo KKR full analysis,charts,indicators,moving averages,SMA,DMA,EMA,ADX,MACD,RSIKkr Co KKR WideScreen charts, DMA,SMA,EMA technical analysis, forecast prediction, by indicators ADX,MACD,RSI,CCI NYSE stock exchange
operates under Finance sector & deals in Investment Managers
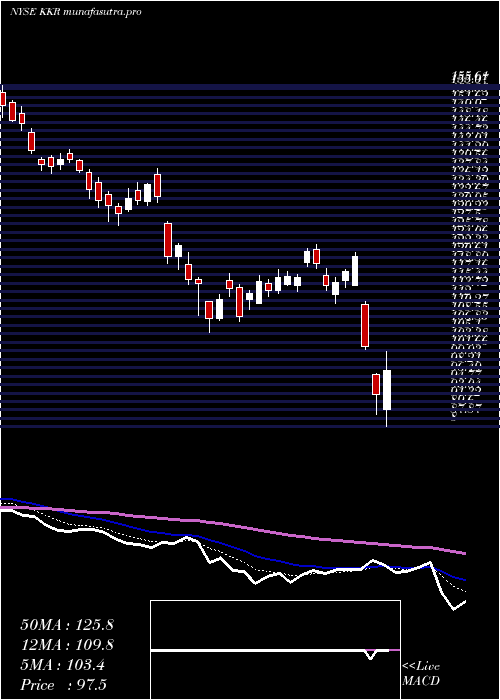
Daily price and charts and targets KkrCo Strong Daily Stock price targets for KkrCo KKR are 127.19 and 129.74 | Daily Target 1 | 125.08 | | Daily Target 2 | 126.75 | | Daily Target 3 | 127.62666666667 | | Daily Target 4 | 129.3 | | Daily Target 5 | 130.18 |
Daily price and volume Kkr Co
| Date |
Closing |
Open |
Range |
Volume |
Thu 04 December 2025 |
128.43 (1.54%) |
126.84 |
125.95 - 128.50 |
0.7777 times |
Wed 03 December 2025 |
126.48 (3.1%) |
123.00 |
122.12 - 126.92 |
0.8349 times |
Tue 02 December 2025 |
122.68 (0.4%) |
122.32 |
121.84 - 123.85 |
0.6607 times |
Mon 01 December 2025 |
122.19 (-0.1%) |
120.49 |
119.09 - 123.21 |
0.7026 times |
Fri 28 November 2025 |
122.31 (1.22%) |
121.28 |
120.63 - 122.85 |
0.3215 times |
Wed 26 November 2025 |
120.83 (0.02%) |
121.11 |
120.30 - 122.61 |
0.9284 times |
Tue 25 November 2025 |
120.81 (2.51%) |
118.73 |
116.15 - 120.92 |
1.2817 times |
Mon 24 November 2025 |
117.85 (-0.69%) |
118.70 |
116.74 - 119.00 |
1.326 times |
Fri 21 November 2025 |
118.67 (3.72%) |
115.07 |
113.83 - 118.89 |
1.6106 times |
Thu 20 November 2025 |
114.41 (-2.63%) |
119.86 |
114.30 - 121.64 |
1.556 times |
Wed 19 November 2025 |
117.50 (2.91%) |
114.60 |
113.11 - 117.52 |
1.004 times |
Weekly price and charts KkrCo Strong weekly Stock price targets for KkrCo KKR are 123.76 and 133.17 | Weekly Target 1 | 115.93 | | Weekly Target 2 | 122.18 | | Weekly Target 3 | 125.34 | | Weekly Target 4 | 131.59 | | Weekly Target 5 | 134.75 |
Weekly price and volumes for Kkr Co
| Date |
Closing |
Open |
Range |
Volume |
Thu 04 December 2025 |
128.43 (5%) |
120.49 |
119.09 - 128.50 |
0.6236 times |
Fri 28 November 2025 |
122.31 (3.07%) |
118.70 |
116.15 - 122.85 |
0.8084 times |
Fri 21 November 2025 |
118.67 (-1.04%) |
119.51 |
112.00 - 121.64 |
1.4994 times |
Fri 14 November 2025 |
119.92 (-1.15%) |
123.52 |
118.52 - 124.70 |
1.4963 times |
Fri 07 November 2025 |
121.32 (2.53%) |
116.97 |
112.09 - 122.13 |
1.2237 times |
Fri 31 October 2025 |
118.33 (0%) |
116.95 |
115.05 - 118.90 |
0.2761 times |
Fri 31 October 2025 |
118.33 (-2.4%) |
122.96 |
115.05 - 124.17 |
1.128 times |
Fri 24 October 2025 |
121.24 (3.1%) |
118.96 |
118.00 - 125.04 |
1.0695 times |
Fri 17 October 2025 |
117.60 (-5.71%) |
119.47 |
115.72 - 128.95 |
1.5331 times |
Tue 07 October 2025 |
124.72 (-2.3%) |
128.25 |
123.76 - 128.70 |
0.3419 times |
Fri 03 October 2025 |
127.65 (-4.75%) |
136.07 |
124.01 - 136.07 |
1.5014 times |
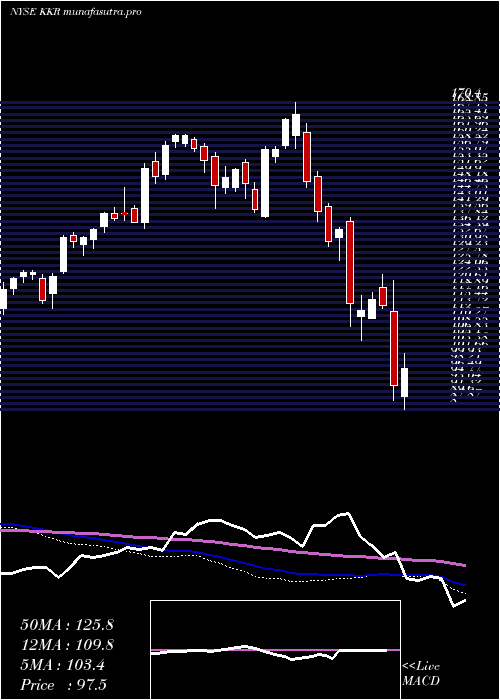
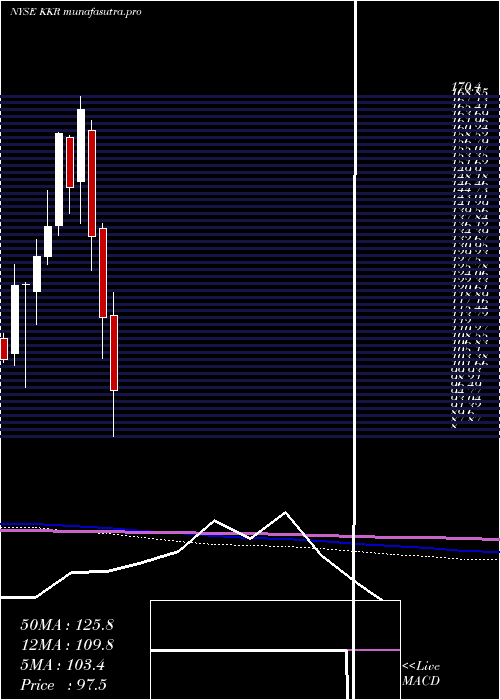
Monthly price and charts KkrCo Strong monthly Stock price targets for KkrCo KKR are 123.76 and 133.17 | Monthly Target 1 | 115.93 | | Monthly Target 2 | 122.18 | | Monthly Target 3 | 125.34 | | Monthly Target 4 | 131.59 | | Monthly Target 5 | 134.75 |
Monthly price and volumes Kkr Co
| Date |
Closing |
Open |
Range |
Volume |
Thu 04 December 2025 |
128.43 (5%) |
120.49 |
119.09 - 128.50 |
0.1278 times |
Fri 28 November 2025 |
122.31 (3.36%) |
116.97 |
112.00 - 124.70 |
1.0305 times |
Fri 31 October 2025 |
118.33 (-8.94%) |
128.26 |
115.05 - 130.32 |
1.0591 times |
Tue 30 September 2025 |
129.95 (-6.84%) |
136.82 |
126.57 - 152.10 |
0.9592 times |
Fri 29 August 2025 |
139.49 (-4.84%) |
143.05 |
136.01 - 149.30 |
0.749 times |
Thu 31 July 2025 |
146.58 (10.19%) |
132.56 |
130.86 - 153.87 |
0.8651 times |
Mon 30 June 2025 |
133.03 (9.53%) |
120.66 |
117.86 - 136.14 |
0.7839 times |
Fri 30 May 2025 |
121.46 (6.29%) |
115.56 |
112.02 - 129.82 |
1.0605 times |
Wed 30 April 2025 |
114.27 (-1.16%) |
116.06 |
86.15 - 121.65 |
1.7306 times |
Mon 31 March 2025 |
115.61 (-14.74%) |
137.60 |
105.29 - 138.87 |
1.6343 times |
Fri 28 February 2025 |
135.59 (-18.84%) |
162.01 |
127.16 - 164.44 |
1.2195 times |
DMA SMA EMA moving averages of Kkr Co KKR
DMA (daily moving average) of Kkr Co KKR
| DMA period | DMA value | | 5 day DMA | 124.42 | | 12 day DMA | 120.53 | | 20 day DMA | 120.31 | | 35 day DMA | 120.11 | | 50 day DMA | 123.45 | | 100 day DMA | 133.24 | | 150 day DMA | 130.22 | | 200 day DMA | 126.42 | EMA (exponential moving average) of Kkr Co KKR
| EMA period | EMA current | EMA prev | EMA prev2 | | 5 day EMA | 124.92 | 123.17 | 121.51 | | 12 day EMA | 122.31 | 121.2 | 120.24 | | 20 day EMA | 121.66 | 120.95 | 120.37 | | 35 day EMA | 123.33 | 123.03 | 122.83 | | 50 day EMA | 125.44 | 125.32 | 125.27 |
SMA (simple moving average) of Kkr Co KKR
| SMA period | SMA current | SMA prev | SMA prev2 | | 5 day SMA | 124.42 | 122.9 | 121.76 | | 12 day SMA | 120.53 | 119.33 | 118.78 | | 20 day SMA | 120.31 | 119.83 | 119.42 | | 35 day SMA | 120.11 | 120 | 119.99 | | 50 day SMA | 123.45 | 123.86 | 124.32 | | 100 day SMA | 133.24 | 133.39 | 133.51 | | 150 day SMA | 130.22 | 130.12 | 130.03 | | 200 day SMA | 126.42 | 126.48 | 126.54 |
|
|
