NuveenReal JRS full analysis,charts,indicators,moving averages,SMA,DMA,EMA,ADX,MACD,RSINuveen Real JRS WideScreen charts, DMA,SMA,EMA technical analysis, forecast prediction, by indicators ADX,MACD,RSI,CCI NYSE stock exchange
operates under N A sector & deals in N A
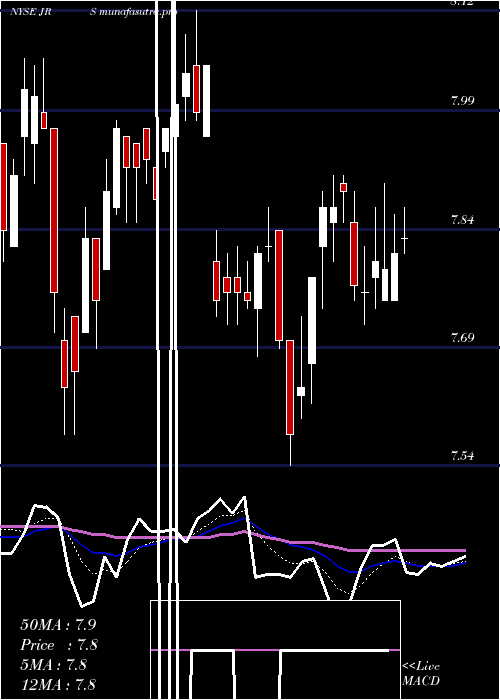
Daily price and charts and targets NuveenReal Strong Daily Stock price targets for NuveenReal JRS are 8.1 and 8.21 | Daily Target 1 | 8.01 | | Daily Target 2 | 8.07 | | Daily Target 3 | 8.1233333333333 | | Daily Target 4 | 8.18 | | Daily Target 5 | 8.23 |
Daily price and volume Nuveen Real
| Date |
Closing |
Open |
Range |
Volume |
Tue 21 October 2025 |
8.12 (0%) |
8.10 |
8.07 - 8.18 |
0.5472 times |
Mon 20 October 2025 |
8.12 (1%) |
8.04 |
8.04 - 8.14 |
0.6065 times |
Fri 17 October 2025 |
8.04 (-0.5%) |
8.02 |
7.95 - 8.07 |
0.861 times |
Thu 16 October 2025 |
8.08 (-0.37%) |
8.12 |
8.05 - 8.16 |
0.8137 times |
Wed 15 October 2025 |
8.11 (1.25%) |
8.07 |
8.01 - 8.17 |
1.8125 times |
Tue 14 October 2025 |
8.01 (0.25%) |
7.94 |
7.93 - 8.02 |
0.8841 times |
Mon 13 October 2025 |
7.99 (-0.75%) |
7.97 |
7.96 - 8.06 |
0.8952 times |
Tue 07 October 2025 |
8.05 (-0.62%) |
8.12 |
8.00 - 8.13 |
0.9294 times |
Mon 06 October 2025 |
8.10 (-0.25%) |
8.12 |
8.08 - 8.36 |
1.8055 times |
Fri 03 October 2025 |
8.12 (-0.25%) |
8.07 |
8.07 - 8.17 |
0.8449 times |
Thu 02 October 2025 |
8.14 (-0.73%) |
8.13 |
8.00 - 8.17 |
1.9123 times |
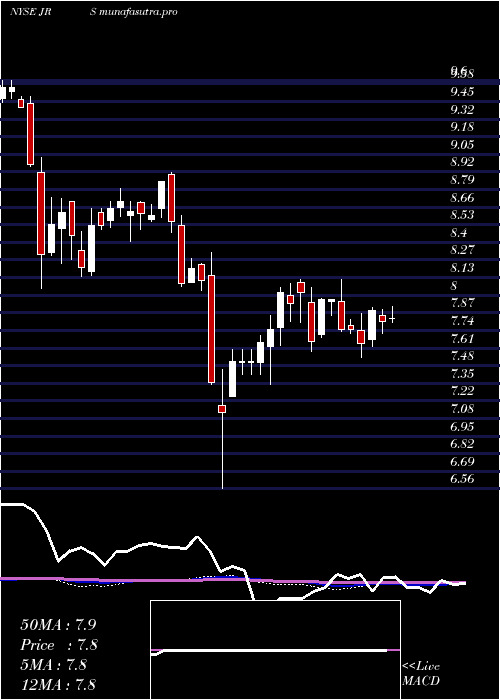
Weekly price and charts NuveenReal Strong weekly Stock price targets for NuveenReal JRS are 8.08 and 8.22 | Weekly Target 1 | 7.97 | | Weekly Target 2 | 8.05 | | Weekly Target 3 | 8.1133333333333 | | Weekly Target 4 | 8.19 | | Weekly Target 5 | 8.25 |
Weekly price and volumes for Nuveen Real
| Date |
Closing |
Open |
Range |
Volume |
Tue 21 October 2025 |
8.12 (1%) |
8.04 |
8.04 - 8.18 |
0.3183 times |
Fri 17 October 2025 |
8.04 (-0.12%) |
7.97 |
7.93 - 8.17 |
1.453 times |
Tue 07 October 2025 |
8.05 (-0.86%) |
8.12 |
8.00 - 8.36 |
0.7545 times |
Fri 03 October 2025 |
8.12 (0.5%) |
8.09 |
8.00 - 8.20 |
1.4265 times |
Fri 26 September 2025 |
8.08 (-1.22%) |
8.19 |
7.99 - 8.21 |
1.518 times |
Fri 19 September 2025 |
8.18 (-2.04%) |
8.18 |
8.08 - 8.25 |
1.1417 times |
Fri 12 September 2025 |
8.35 (2.08%) |
8.19 |
8.15 - 8.38 |
1.1211 times |
Fri 05 September 2025 |
8.18 (0.74%) |
8.04 |
7.96 - 8.20 |
0.7729 times |
Fri 29 August 2025 |
8.12 (0%) |
8.04 |
8.04 - 8.12 |
0.1487 times |
Fri 29 August 2025 |
8.12 (1.12%) |
8.03 |
7.95 - 8.12 |
1.3453 times |
Fri 22 August 2025 |
8.03 (4.42%) |
7.73 |
7.65 - 8.09 |
1.4042 times |
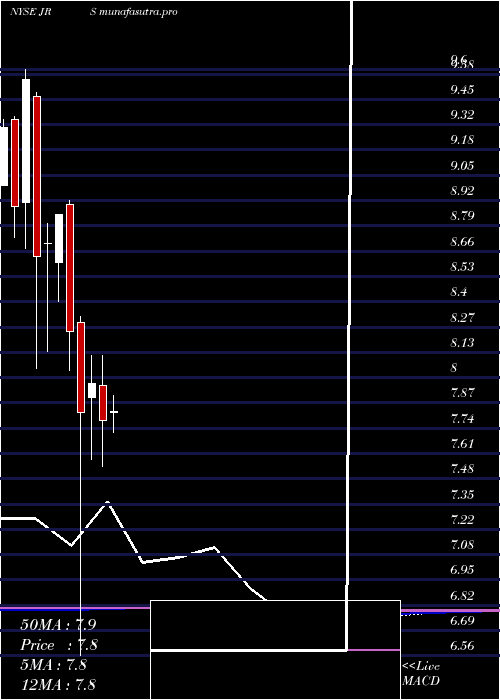
Monthly price and charts NuveenReal Strong monthly Stock price targets for NuveenReal JRS are 7.81 and 8.24 | Monthly Target 1 | 7.71 | | Monthly Target 2 | 7.91 | | Monthly Target 3 | 8.1366666666667 | | Monthly Target 4 | 8.34 | | Monthly Target 5 | 8.57 |
Monthly price and volumes Nuveen Real
| Date |
Closing |
Open |
Range |
Volume |
Tue 21 October 2025 |
8.12 (-0.73%) |
8.20 |
7.93 - 8.36 |
0.7757 times |
Tue 30 September 2025 |
8.18 (0.74%) |
8.04 |
7.96 - 8.38 |
1.0856 times |
Fri 29 August 2025 |
8.12 (6.01%) |
7.67 |
7.53 - 8.12 |
1.0399 times |
Thu 31 July 2025 |
7.66 (-1.54%) |
7.82 |
7.64 - 8.10 |
1.2388 times |
Mon 30 June 2025 |
7.78 (-2.38%) |
7.96 |
7.54 - 8.12 |
0.8927 times |
Fri 30 May 2025 |
7.97 (1.92%) |
7.90 |
7.58 - 8.12 |
1.0079 times |
Wed 30 April 2025 |
7.82 (-5.1%) |
8.29 |
6.56 - 8.32 |
1.357 times |
Mon 31 March 2025 |
8.24 (-6.89%) |
8.90 |
8.04 - 8.92 |
0.8006 times |
Fri 28 February 2025 |
8.85 (1.72%) |
8.60 |
8.40 - 8.85 |
0.8987 times |
Fri 31 January 2025 |
8.70 (0.81%) |
8.70 |
8.14 - 8.80 |
0.9032 times |
Tue 31 December 2024 |
8.63 (-9.63%) |
9.46 |
8.05 - 9.48 |
0.9302 times |
DMA SMA EMA moving averages of Nuveen Real JRS
DMA (daily moving average) of Nuveen Real JRS
| DMA period | DMA value | | 5 day DMA | 8.09 | | 12 day DMA | 8.09 | | 20 day DMA | 8.1 | | 35 day DMA | 8.12 | | 50 day DMA | 8.03 | | 100 day DMA | 7.93 | | 150 day DMA | 7.89 | | 200 day DMA | 8.06 | EMA (exponential moving average) of Nuveen Real JRS
| EMA period | EMA current | EMA prev | EMA prev2 | | 5 day EMA | 8.09 | 8.08 | 8.06 | | 12 day EMA | 8.09 | 8.08 | 8.07 | | 20 day EMA | 8.08 | 8.08 | 8.08 | | 35 day EMA | 8.04 | 8.04 | 8.03 | | 50 day EMA | 8 | 8 | 7.99 |
SMA (simple moving average) of Nuveen Real JRS
| SMA period | SMA current | SMA prev | SMA prev2 | | 5 day SMA | 8.09 | 8.07 | 8.05 | | 12 day SMA | 8.09 | 8.1 | 8.09 | | 20 day SMA | 8.1 | 8.1 | 8.1 | | 35 day SMA | 8.12 | 8.12 | 8.12 | | 50 day SMA | 8.03 | 8.02 | 8.01 | | 100 day SMA | 7.93 | 7.92 | 7.92 | | 150 day SMA | 7.89 | 7.89 | 7.89 | | 200 day SMA | 8.06 | 8.06 | 8.07 |
|
|
