JpmorganChase JPM-C full analysis,charts,indicators,moving averages,SMA,DMA,EMA,ADX,MACD,RSIJpmorgan Chase JPM-C WideScreen charts, DMA,SMA,EMA technical analysis, forecast prediction, by indicators ADX,MACD,RSI,CCI NYSE stock exchange
Daily price and charts and targets JpmorganChase Strong Daily Stock price targets for JpmorganChase JPM-C are 25.57 and 25.69 | Daily Target 1 | 25.54 | | Daily Target 2 | 25.59 | | Daily Target 3 | 25.656666666667 | | Daily Target 4 | 25.71 | | Daily Target 5 | 25.78 |
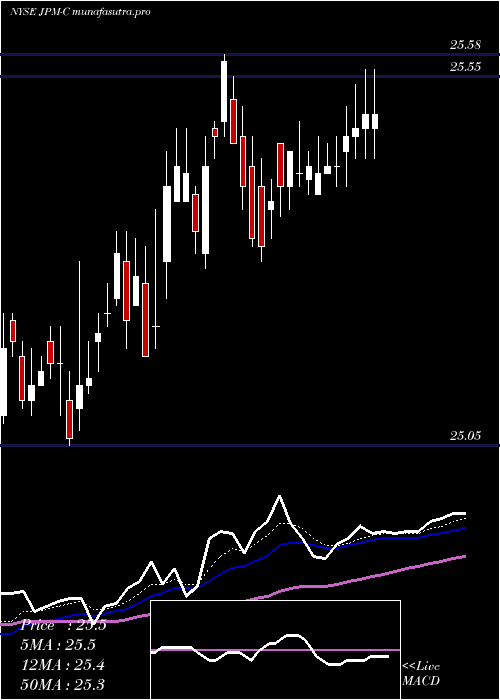
Daily price and volume Jpmorgan Chase
| Date |
Closing |
Open |
Range |
Volume |
Mon 20 October 2025 |
25.65 (0.23%) |
25.68 |
25.60 - 25.72 |
0.7711 times |
Fri 17 October 2025 |
25.59 (0.08%) |
25.61 |
25.58 - 25.65 |
0.6088 times |
Thu 16 October 2025 |
25.57 (-0.23%) |
25.69 |
25.56 - 25.69 |
0.8277 times |
Wed 15 October 2025 |
25.63 (-0.04%) |
25.67 |
25.62 - 25.72 |
0.9257 times |
Tue 14 October 2025 |
25.64 (0.23%) |
25.57 |
25.54 - 25.68 |
1.0325 times |
Mon 13 October 2025 |
25.58 (0.16%) |
25.60 |
25.56 - 25.63 |
0.6633 times |
Fri 10 October 2025 |
25.54 (-0.04%) |
25.57 |
25.50 - 25.61 |
2.4069 times |
Thu 09 October 2025 |
25.55 (0.12%) |
25.47 |
25.46 - 25.56 |
1.3091 times |
Wed 08 October 2025 |
25.52 (-0.12%) |
25.52 |
25.51 - 25.59 |
0.6916 times |
Tue 07 October 2025 |
25.55 (0.04%) |
25.58 |
25.51 - 25.59 |
0.7635 times |
Mon 06 October 2025 |
25.54 (0%) |
25.48 |
25.46 - 25.56 |
0.4596 times |
Weekly price and charts JpmorganChase Strong weekly Stock price targets for JpmorganChase JPM-C are 25.57 and 25.69 | Weekly Target 1 | 25.54 | | Weekly Target 2 | 25.59 | | Weekly Target 3 | 25.656666666667 | | Weekly Target 4 | 25.71 | | Weekly Target 5 | 25.78 |
Weekly price and volumes for Jpmorgan Chase
| Date |
Closing |
Open |
Range |
Volume |
Mon 20 October 2025 |
25.65 (0.23%) |
25.68 |
25.60 - 25.72 |
0.1771 times |
Fri 17 October 2025 |
25.59 (0.2%) |
25.60 |
25.54 - 25.72 |
0.9322 times |
Fri 10 October 2025 |
25.54 (0%) |
25.48 |
25.46 - 25.61 |
1.2935 times |
Fri 03 October 2025 |
25.54 (0.67%) |
25.41 |
25.33 - 25.56 |
1.3318 times |
Fri 26 September 2025 |
25.37 (-0.78%) |
25.62 |
25.37 - 25.62 |
1.5305 times |
Fri 19 September 2025 |
25.57 (-0.23%) |
25.63 |
25.57 - 25.74 |
1.1109 times |
Fri 12 September 2025 |
25.63 (0.31%) |
25.56 |
25.54 - 25.69 |
0.9525 times |
Fri 05 September 2025 |
25.55 (0.51%) |
25.40 |
25.33 - 25.58 |
0.9225 times |
Fri 29 August 2025 |
25.42 (0%) |
25.33 |
25.33 - 25.43 |
0.5449 times |
Fri 29 August 2025 |
25.42 (-0.12%) |
25.44 |
25.31 - 25.45 |
1.204 times |
Fri 22 August 2025 |
25.45 (0.28%) |
25.41 |
25.35 - 25.50 |
1.1657 times |

Monthly price and charts JpmorganChase Strong monthly Stock price targets for JpmorganChase JPM-C are 25.5 and 25.88 | Monthly Target 1 | 25.19 | | Monthly Target 2 | 25.42 | | Monthly Target 3 | 25.57 | | Monthly Target 4 | 25.8 | | Monthly Target 5 | 25.95 |
Monthly price and volumes Jpmorgan Chase
| Date |
Closing |
Open |
Range |
Volume |
Mon 20 October 2025 |
25.65 (1.14%) |
25.34 |
25.34 - 25.72 |
0.423 times |
Tue 30 September 2025 |
25.36 (-0.24%) |
25.40 |
25.33 - 25.74 |
0.8279 times |
Fri 29 August 2025 |
25.42 (-0.31%) |
25.48 |
25.19 - 25.56 |
0.7994 times |
Thu 31 July 2025 |
25.50 (1.15%) |
25.30 |
25.25 - 25.58 |
1.0291 times |
Mon 30 June 2025 |
25.21 (0.36%) |
25.05 |
24.97 - 25.37 |
1.2652 times |
Fri 30 May 2025 |
25.12 (0.36%) |
25.07 |
24.74 - 25.12 |
1.7626 times |
Wed 30 April 2025 |
25.03 (0.04%) |
25.06 |
24.79 - 25.30 |
1.5072 times |
Mon 31 March 2025 |
25.02 (-1.46%) |
25.41 |
25.02 - 25.47 |
0.645 times |
Fri 28 February 2025 |
25.39 (1.36%) |
25.03 |
25.02 - 25.42 |
0.5438 times |
Fri 31 January 2025 |
25.05 (-1.53%) |
25.44 |
25.02 - 25.68 |
1.1968 times |
Tue 31 December 2024 |
25.44 (0.32%) |
25.34 |
25.06 - 25.45 |
0.972 times |

DMA SMA EMA moving averages of Jpmorgan Chase JPM-C
DMA (daily moving average) of Jpmorgan Chase JPM-C
| DMA period | DMA value | | 5 day DMA | 25.62 | | 12 day DMA | 25.58 | | 20 day DMA | 25.52 | | 35 day DMA | 25.54 | | 50 day DMA | 25.49 | | 100 day DMA | 25.39 | | 150 day DMA | 25.28 | | 200 day DMA | 25.29 | EMA (exponential moving average) of Jpmorgan Chase JPM-C
| EMA period | EMA current | EMA prev | EMA prev2 | | 5 day EMA | 25.61 | 25.59 | 25.59 | | 12 day EMA | 25.57 | 25.56 | 25.56 | | 20 day EMA | 25.55 | 25.54 | 25.53 | | 35 day EMA | 25.52 | 25.51 | 25.5 | | 50 day EMA | 25.49 | 25.48 | 25.48 |
SMA (simple moving average) of Jpmorgan Chase JPM-C
| SMA period | SMA current | SMA prev | SMA prev2 | | 5 day SMA | 25.62 | 25.6 | 25.59 | | 12 day SMA | 25.58 | 25.56 | 25.55 | | 20 day SMA | 25.52 | 25.52 | 25.52 | | 35 day SMA | 25.54 | 25.53 | 25.53 | | 50 day SMA | 25.49 | 25.48 | 25.48 | | 100 day SMA | 25.39 | 25.38 | 25.37 | | 150 day SMA | 25.28 | 25.28 | 25.28 | | 200 day SMA | 25.29 | 25.29 | 25.29 |
|
|
