JP JPM full analysis,charts,indicators,moving averages,SMA,DMA,EMA,ADX,MACD,RSIJ P JPM WideScreen charts, DMA,SMA,EMA technical analysis, forecast prediction, by indicators ADX,MACD,RSI,CCI NYSE stock exchange
operates under Finance sector & deals in Major Banks
Daily price and charts and targets JP Strong Daily Stock price targets for JP JPM are 293.21 and 298.56 | Daily Target 1 | 291.75 | | Daily Target 2 | 294.66 | | Daily Target 3 | 297.10333333333 | | Daily Target 4 | 300.01 | | Daily Target 5 | 302.45 |
Daily price and volume J P
| Date |
Closing |
Open |
Range |
Volume |
Fri 17 October 2025 |
297.56 (-0.33%) |
299.16 |
294.20 - 299.55 |
1.1247 times |
Thu 16 October 2025 |
298.54 (-2.34%) |
305.35 |
297.07 - 308.68 |
1.1684 times |
Wed 15 October 2025 |
305.69 (1.2%) |
306.39 |
305.44 - 312.12 |
1.2586 times |
Tue 14 October 2025 |
302.08 (-1.91%) |
305.84 |
294.21 - 307.00 |
1.7933 times |
Mon 13 October 2025 |
307.97 (0.09%) |
305.60 |
305.45 - 309.46 |
1.1959 times |
Tue 07 October 2025 |
307.69 (-0.36%) |
309.35 |
304.70 - 310.01 |
0.9371 times |
Mon 06 October 2025 |
308.80 (-0.54%) |
310.08 |
305.13 - 311.75 |
0.4683 times |
Fri 03 October 2025 |
310.47 (0.74%) |
308.73 |
308.15 - 311.66 |
0.4709 times |
Thu 02 October 2025 |
308.20 (-0.81%) |
311.05 |
306.14 - 311.19 |
0.5591 times |
Wed 01 October 2025 |
310.71 (-1.5%) |
313.97 |
307.41 - 314.59 |
1.0236 times |
Tue 30 September 2025 |
315.43 (-0.08%) |
316.25 |
310.11 - 317.41 |
1.3105 times |
Weekly price and charts JP Strong weekly Stock price targets for JP JPM are 286.92 and 304.84 | Weekly Target 1 | 283.37 | | Weekly Target 2 | 290.47 | | Weekly Target 3 | 301.29333333333 | | Weekly Target 4 | 308.39 | | Weekly Target 5 | 319.21 |
Weekly price and volumes for J P
| Date |
Closing |
Open |
Range |
Volume |
Fri 17 October 2025 |
297.56 (-3.29%) |
305.60 |
294.20 - 312.12 |
1.7088 times |
Tue 07 October 2025 |
307.69 (-0.9%) |
310.08 |
304.70 - 311.75 |
0.3671 times |
Fri 03 October 2025 |
310.47 (-1.77%) |
317.06 |
306.14 - 318.01 |
1.066 times |
Fri 26 September 2025 |
316.06 (0.41%) |
309.80 |
309.55 - 317.81 |
1.0931 times |
Fri 19 September 2025 |
314.78 (2.56%) |
307.17 |
307.13 - 315.80 |
1.677 times |
Fri 12 September 2025 |
306.91 (4.26%) |
294.89 |
291.44 - 307.55 |
1.118 times |
Fri 05 September 2025 |
294.38 (-2.34%) |
300.26 |
294.31 - 305.15 |
0.8681 times |
Fri 29 August 2025 |
301.42 (0%) |
302.04 |
299.73 - 302.95 |
0.1966 times |
Fri 29 August 2025 |
301.42 (1.75%) |
296.24 |
293.50 - 302.95 |
0.9217 times |
Fri 22 August 2025 |
296.24 (1.98%) |
290.00 |
287.27 - 297.16 |
0.9836 times |
Fri 15 August 2025 |
290.49 (0.6%) |
289.40 |
287.16 - 295.50 |
1.0472 times |

Monthly price and charts JP Strong monthly Stock price targets for JP JPM are 285.69 and 306.08 | Monthly Target 1 | 281.73 | | Monthly Target 2 | 289.64 | | Monthly Target 3 | 302.11666666667 | | Monthly Target 4 | 310.03 | | Monthly Target 5 | 322.51 |
Monthly price and volumes J P
| Date |
Closing |
Open |
Range |
Volume |
Fri 17 October 2025 |
297.56 (-5.67%) |
313.97 |
294.20 - 314.59 |
0.4871 times |
Tue 30 September 2025 |
315.43 (4.65%) |
300.26 |
291.44 - 318.01 |
0.9855 times |
Fri 29 August 2025 |
301.42 (1.75%) |
290.40 |
284.24 - 302.95 |
0.8042 times |
Thu 31 July 2025 |
296.24 (2.18%) |
290.89 |
280.31 - 301.29 |
1.07 times |
Mon 30 June 2025 |
289.91 (9.81%) |
263.02 |
260.31 - 292.65 |
0.8941 times |
Fri 30 May 2025 |
264.00 (7.92%) |
242.84 |
242.17 - 269.52 |
0.8896 times |
Wed 30 April 2025 |
244.62 (-0.28%) |
242.62 |
202.16 - 247.25 |
1.4157 times |
Mon 31 March 2025 |
245.30 (-7.31%) |
264.00 |
224.23 - 266.32 |
1.3367 times |
Fri 28 February 2025 |
264.65 (-0.99%) |
261.83 |
253.35 - 280.25 |
0.8456 times |
Fri 31 January 2025 |
267.30 (11.51%) |
240.92 |
238.74 - 270.82 |
1.2716 times |
Tue 31 December 2024 |
239.71 (-4.1%) |
248.23 |
229.53 - 248.92 |
0.7735 times |
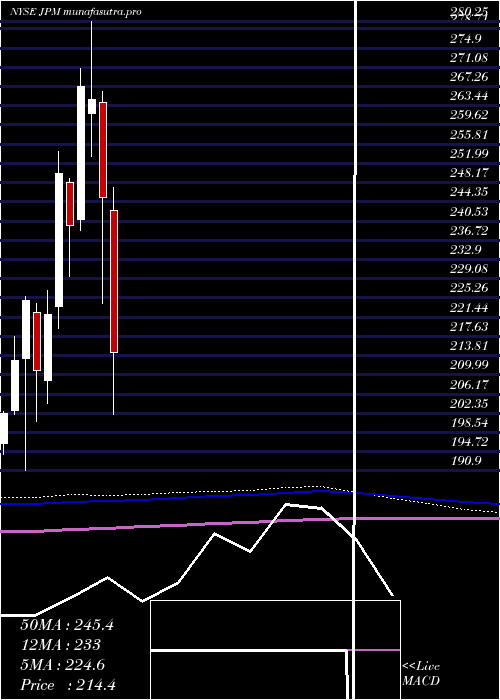
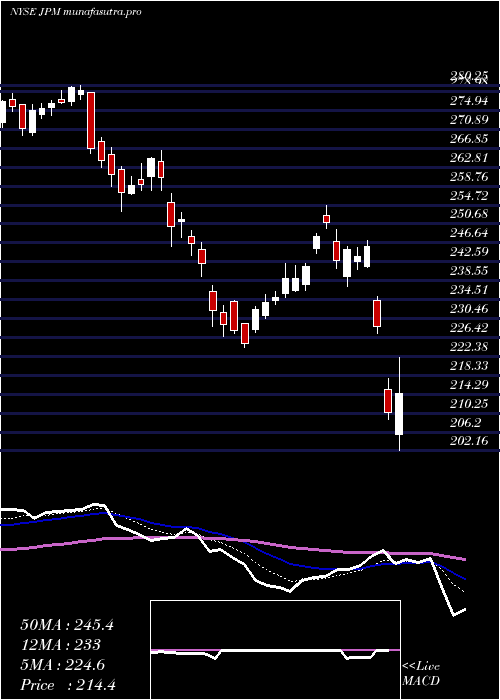
DMA SMA EMA moving averages of J P JPM
DMA (daily moving average) of J P JPM
| DMA period | DMA value | | 5 day DMA | 302.37 | | 12 day DMA | 307.4 | | 20 day DMA | 309.84 | | 35 day DMA | 306.26 | | 50 day DMA | 301.99 | | 100 day DMA | 291.26 | | 150 day DMA | 274.6 | | 200 day DMA | 270.53 | EMA (exponential moving average) of J P JPM
| EMA period | EMA current | EMA prev | EMA prev2 | | 5 day EMA | 301.69 | 303.76 | 306.37 | | 12 day EMA | 305.4 | 306.82 | 308.33 | | 20 day EMA | 306.26 | 307.18 | 308.09 | | 35 day EMA | 304.56 | 304.97 | 305.35 | | 50 day EMA | 301.38 | 301.54 | 301.66 |
SMA (simple moving average) of J P JPM
| SMA period | SMA current | SMA prev | SMA prev2 | | 5 day SMA | 302.37 | 304.39 | 306.45 | | 12 day SMA | 307.4 | 308.94 | 310.19 | | 20 day SMA | 309.84 | 310.42 | 310.93 | | 35 day SMA | 306.26 | 306.29 | 306.19 | | 50 day SMA | 301.99 | 301.86 | 301.68 | | 100 day SMA | 291.26 | 290.94 | 290.61 | | 150 day SMA | 274.6 | 274.14 | 273.7 | | 200 day SMA | 270.53 | 270.25 | 269.97 |
|
|
