NuveenMortgage JLS full analysis,charts,indicators,moving averages,SMA,DMA,EMA,ADX,MACD,RSINuveen Mortgage JLS WideScreen charts, DMA,SMA,EMA technical analysis, forecast prediction, by indicators ADX,MACD,RSI,CCI NYSE stock exchange
operates under N A sector & deals in N A
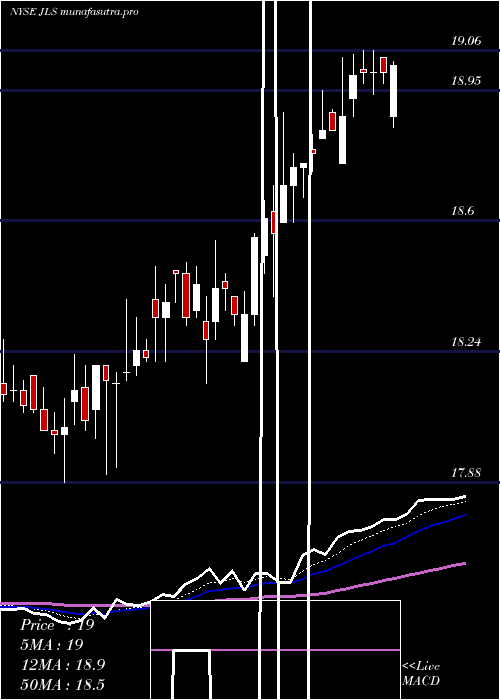
Daily price and charts and targets NuveenMortgage Strong Daily Stock price targets for NuveenMortgage JLS are 18.54 and 18.61 | Daily Target 1 | 18.52 | | Daily Target 2 | 18.55 | | Daily Target 3 | 18.59 | | Daily Target 4 | 18.62 | | Daily Target 5 | 18.66 |
Daily price and volume Nuveen Mortgage
| Date |
Closing |
Open |
Range |
Volume |
Thu 04 December 2025 |
18.58 (0.11%) |
18.62 |
18.56 - 18.63 |
1.25 times |
Wed 03 December 2025 |
18.56 (0.05%) |
18.55 |
18.55 - 18.67 |
0.9195 times |
Tue 02 December 2025 |
18.55 (-0.32%) |
18.58 |
18.54 - 18.69 |
0.9986 times |
Mon 01 December 2025 |
18.61 (0.05%) |
18.63 |
18.56 - 18.72 |
1.2141 times |
Fri 28 November 2025 |
18.60 (-0.27%) |
18.61 |
18.56 - 18.74 |
0.9698 times |
Wed 26 November 2025 |
18.65 (-0.21%) |
18.65 |
18.60 - 18.75 |
0.9698 times |
Tue 25 November 2025 |
18.69 (0.32%) |
18.72 |
18.61 - 18.72 |
1.171 times |
Mon 24 November 2025 |
18.63 (-0.37%) |
18.65 |
18.55 - 18.69 |
1.1494 times |
Fri 21 November 2025 |
18.70 (-0.16%) |
18.74 |
18.51 - 18.76 |
0.625 times |
Thu 20 November 2025 |
18.73 (0.32%) |
18.61 |
18.48 - 18.78 |
0.7328 times |
Wed 19 November 2025 |
18.67 (-0.43%) |
18.69 |
18.61 - 18.70 |
0.7112 times |
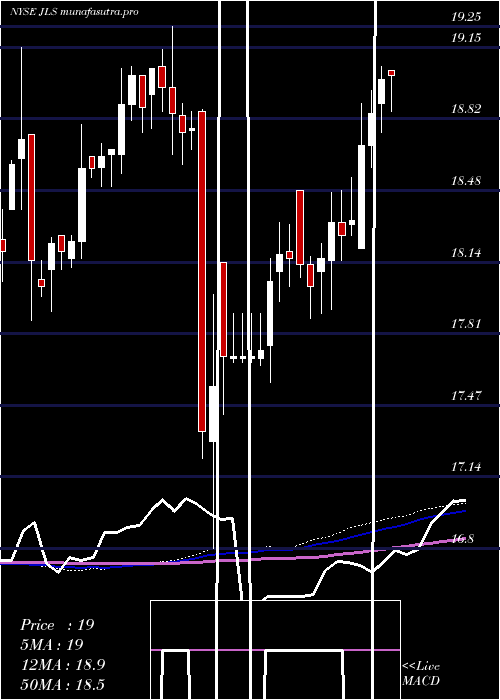
Weekly price and charts NuveenMortgage Strong weekly Stock price targets for NuveenMortgage JLS are 18.47 and 18.65 | Weekly Target 1 | 18.43 | | Weekly Target 2 | 18.51 | | Weekly Target 3 | 18.613333333333 | | Weekly Target 4 | 18.69 | | Weekly Target 5 | 18.79 |
Weekly price and volumes for Nuveen Mortgage
| Date |
Closing |
Open |
Range |
Volume |
Thu 04 December 2025 |
18.58 (-0.11%) |
18.63 |
18.54 - 18.72 |
1.0316 times |
Fri 28 November 2025 |
18.60 (-0.53%) |
18.65 |
18.55 - 18.75 |
1.0029 times |
Fri 21 November 2025 |
18.70 (-0.37%) |
18.81 |
18.48 - 18.91 |
0.9301 times |
Fri 14 November 2025 |
18.77 (0.05%) |
18.80 |
18.50 - 18.90 |
1.5542 times |
Fri 07 November 2025 |
18.76 (-0.16%) |
18.75 |
18.42 - 18.81 |
0.7526 times |
Fri 31 October 2025 |
18.79 (0%) |
18.78 |
18.66 - 18.79 |
0.3298 times |
Fri 31 October 2025 |
18.79 (0.75%) |
18.69 |
18.33 - 18.79 |
1.292 times |
Fri 24 October 2025 |
18.65 (-0.75%) |
18.71 |
18.49 - 18.80 |
1.4882 times |
Fri 17 October 2025 |
18.79 (0.64%) |
18.79 |
18.65 - 18.98 |
1.1009 times |
Tue 07 October 2025 |
18.67 (-0.16%) |
18.68 |
18.50 - 18.89 |
0.5177 times |
Fri 03 October 2025 |
18.70 (-0.8%) |
18.85 |
18.38 - 19.03 |
1.3307 times |
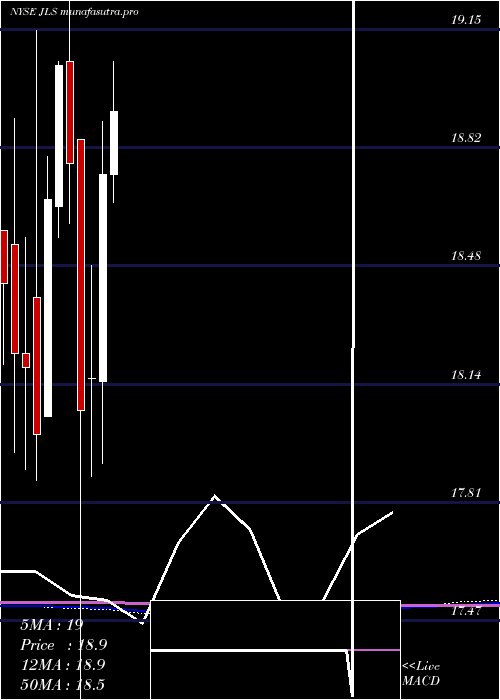
Monthly price and charts NuveenMortgage Strong monthly Stock price targets for NuveenMortgage JLS are 18.47 and 18.65 | Monthly Target 1 | 18.43 | | Monthly Target 2 | 18.51 | | Monthly Target 3 | 18.613333333333 | | Monthly Target 4 | 18.69 | | Monthly Target 5 | 18.79 |
Monthly price and volumes Nuveen Mortgage
| Date |
Closing |
Open |
Range |
Volume |
Thu 04 December 2025 |
18.58 (-0.11%) |
18.63 |
18.54 - 18.72 |
0.1717 times |
Fri 28 November 2025 |
18.60 (-1.01%) |
18.75 |
18.42 - 18.91 |
0.7059 times |
Fri 31 October 2025 |
18.79 (0.37%) |
18.75 |
18.33 - 19.03 |
0.9043 times |
Tue 30 September 2025 |
18.72 (-0.43%) |
18.83 |
18.26 - 19.09 |
1.3596 times |
Fri 29 August 2025 |
18.80 (-0.48%) |
18.97 |
18.66 - 19.02 |
0.8708 times |
Thu 31 July 2025 |
18.89 (0.8%) |
18.74 |
18.63 - 19.06 |
1.1498 times |
Mon 30 June 2025 |
18.74 (3.19%) |
18.15 |
17.92 - 18.89 |
0.792 times |
Fri 30 May 2025 |
18.16 (0.5%) |
18.16 |
17.88 - 18.48 |
1.1979 times |
Wed 30 April 2025 |
18.07 (-3.73%) |
18.84 |
16.80 - 18.84 |
2.046 times |
Mon 31 March 2025 |
18.77 (-1.47%) |
19.06 |
18.60 - 19.25 |
0.8018 times |
Fri 28 February 2025 |
19.05 (2.04%) |
18.65 |
18.56 - 19.06 |
0.8934 times |
DMA SMA EMA moving averages of Nuveen Mortgage JLS
DMA (daily moving average) of Nuveen Mortgage JLS
| DMA period | DMA value | | 5 day DMA | 18.58 | | 12 day DMA | 18.64 | | 20 day DMA | 18.71 | | 35 day DMA | 18.7 | | 50 day DMA | 18.73 | | 100 day DMA | 18.8 | | 150 day DMA | 18.65 | | 200 day DMA | 18.58 | EMA (exponential moving average) of Nuveen Mortgage JLS
| EMA period | EMA current | EMA prev | EMA prev2 | | 5 day EMA | 18.59 | 18.59 | 18.61 | | 12 day EMA | 18.63 | 18.64 | 18.66 | | 20 day EMA | 18.67 | 18.68 | 18.69 | | 35 day EMA | 18.71 | 18.72 | 18.73 | | 50 day EMA | 18.72 | 18.73 | 18.74 |
SMA (simple moving average) of Nuveen Mortgage JLS
| SMA period | SMA current | SMA prev | SMA prev2 | | 5 day SMA | 18.58 | 18.59 | 18.62 | | 12 day SMA | 18.64 | 18.66 | 18.68 | | 20 day SMA | 18.71 | 18.71 | 18.72 | | 35 day SMA | 18.7 | 18.71 | 18.72 | | 50 day SMA | 18.73 | 18.74 | 18.75 | | 100 day SMA | 18.8 | 18.81 | 18.81 | | 150 day SMA | 18.65 | 18.64 | 18.64 | | 200 day SMA | 18.58 | 18.59 | 18.59 |
|
|
